We use standard 5-fold cross-validation to evaluate our BiC(RoBiC, ...) system: we first divided the data into 5 balanced folds FF = {F1, …, F5} then use the information in FF - { Fi} to find labels for each instance ri,j ∈ Fi. Now recall, however, that BiC(RoBiC, ...)'s first step involves finding the biclusters based on both (the nonlabel part of) FF - { Fi} and Fi --- ie on all of FF. This means the biclusters (and hence the classification) for r5,1 depends on r5,2, r5,3, ... r5,3, as well as F1, …, F4.
Does this make a difference? In particular, how does the scenario compare with the more "standard" version, where the label for r5,1 depends only on itself and F1, …, F4, but NOT r5,2, r5,3, ... r5,15.
To find out, we took 4/5 of the BreastCancer data as the training set D, which here has 61 instances. We then considered each of the remaining 15 elements R = { r1, r2, ... r15} one by one. Here, we used the set of instances Di = D ∪ { ri } to produce the set of k=30 biclusters, Bi = { Bi,1, Bi,2, ..., Bi,k} = RoBiC( Di, k).
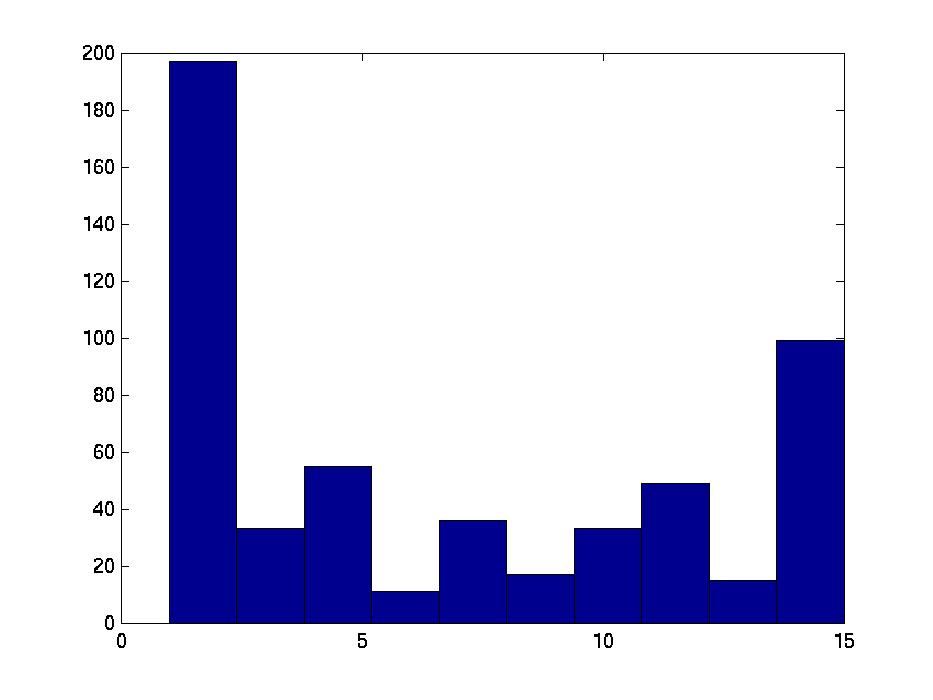
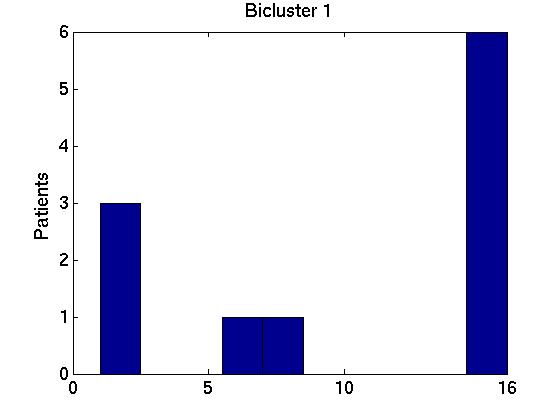
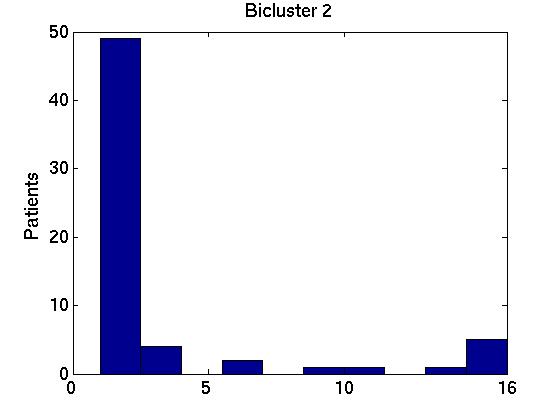
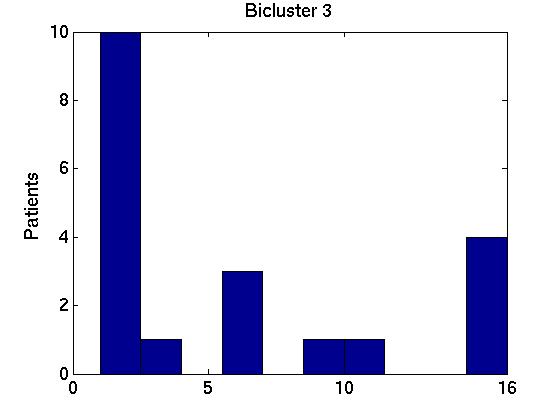
Of course, each of these Bi bicluster sets can be very different from one another. We can allay some of our worries if we find that these 15 different bicluster sets are similar to one another, and also to the biclusters obtained using the full FF set of instances, B* = RoBiC( FF, k). Below we present two ways to measure these similarities, focussing on just the first three biclusters for each set --- ie, comparing the members of {Bi,1}i = {B1,1, B2,1, ..., B15,1} with one another and with B*1; then comparing {Bi,2}i with each other and with B*2; and finally dealing with {Bi,3}i and B*3. For notation: each bicluster Bi,j involves a particular set of genes Gi,j.
(See also UseOnlyTraining for another way to use only the training data.)
| F(A, B) = Fmeasure(A, B) = |
|
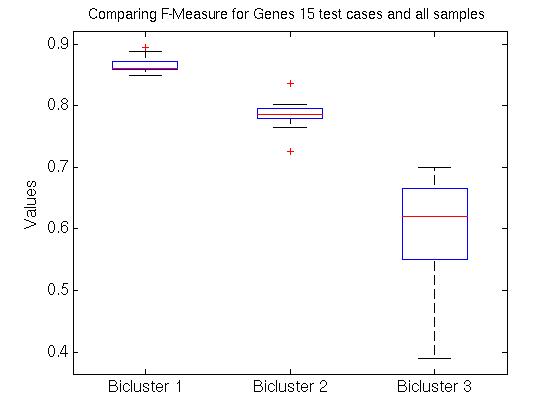
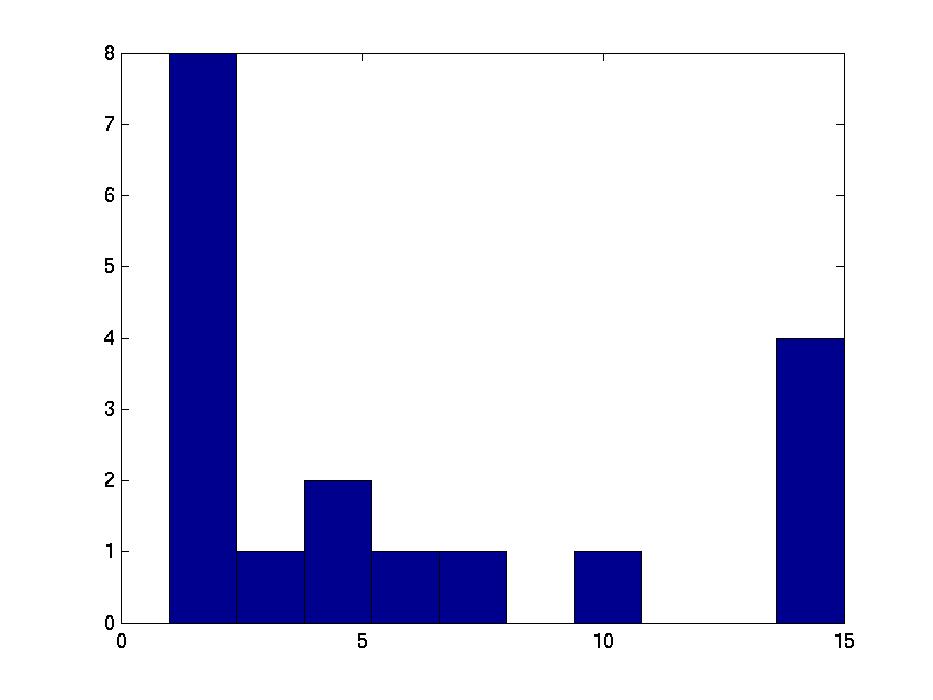
We therefore computed the 15 values F( Gi,1, G1*), associated with the first bicluster of each bicluster-set. This is graphed in the far left region in left plot in Figure 1 below, as a box-and-whisker plot (produced with Matlab's BOXPLOT). (This plot in corresponds to the 15 values of F( Gi,1, G1*) over the 15 single patient additions.) We see that the mean is around 0.85, and one standard deviation is only a few percent. The middle region in this graph corresponds to the second biclusters { F( Gi,2, G2*) }; and the far right to the third biclusters { F( Gi,3, G3*) }.
| |
|
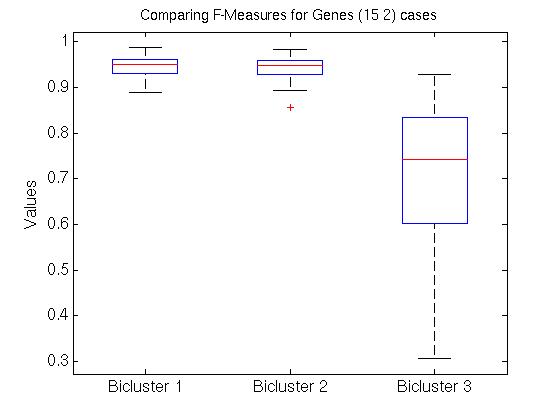
We also compared all (15 2) pairs F( Gi,1, Gj,1 ) pairs, for (i ≠ j). The left graph of the Figure shows those values, for the first, second and third biclusters. Notice the average F-score here is around 0.95 for both the first and 2nd biclusters.
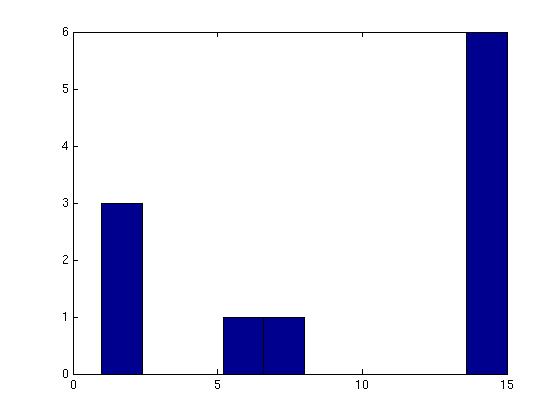
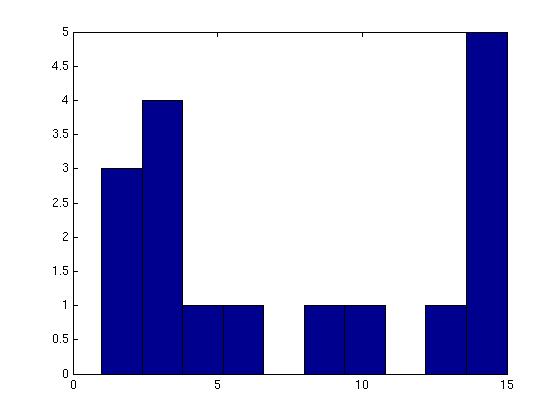
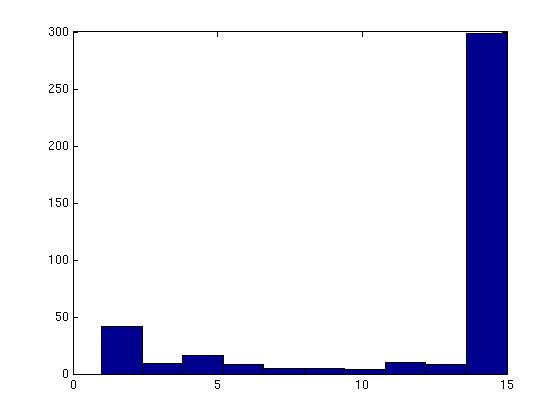
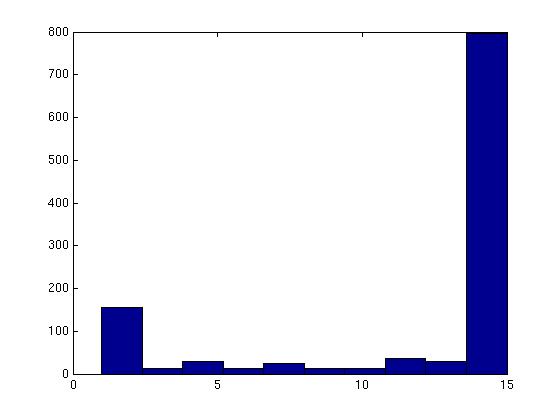
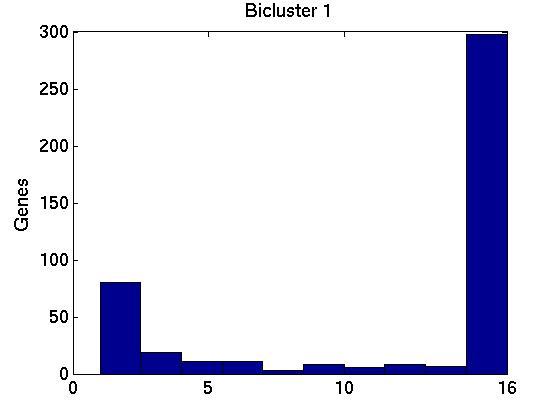
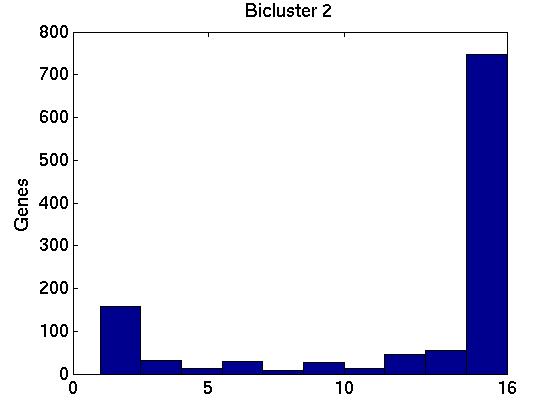
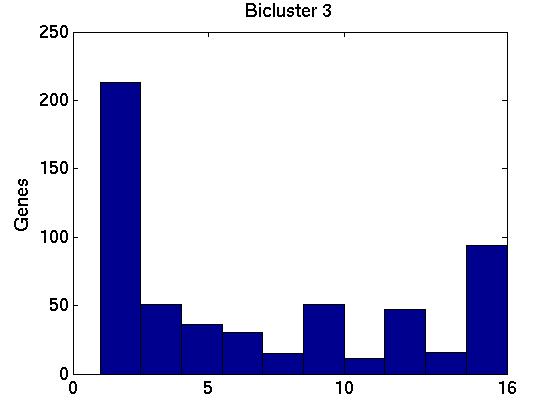
Figure 3 deals with genes. We note that almost 300 genes (of around 400) appear in all 15 bicluster#1's, and around 800 (of 1000) genes in all 15 bicluster#2's.
 |
 |
 |
 |
 |
 |
 |
 |
 |
 |
 |
 |