Quantitative image analysis for detecting iron in MS |
|
Dana Cobzas, Ahmed Elkady Hongfu Sun Gregg Blevins Alan Wilman, |
ReferencesElkady A., Cobzas D., Sun H., Blevins G., Wilman A.H., Progressive Iron Accumulation in MS Revealed by Sparse Classification of Deep Gray Matter J Magn Reson Imaging ,2017 Kmech J., Fujiwara E., Cobzas D., Sun H., Seres P., Blevins G., Wilman A.H., Cognitive signifcance of deep grey matter iron in multiple sclerosis , American Journal of Neuroradiology , 2017 Cobzas D, Sun H, Walsh AJ, Lebel RM, Blevins G, Wilman AH. Subcortical gray matter segmentation and voxel-based analysis using transverse relaxation and quantitative susceptibility mapping with application to multiple sclerosis. , J Magn Reson Imaging , 2015 |
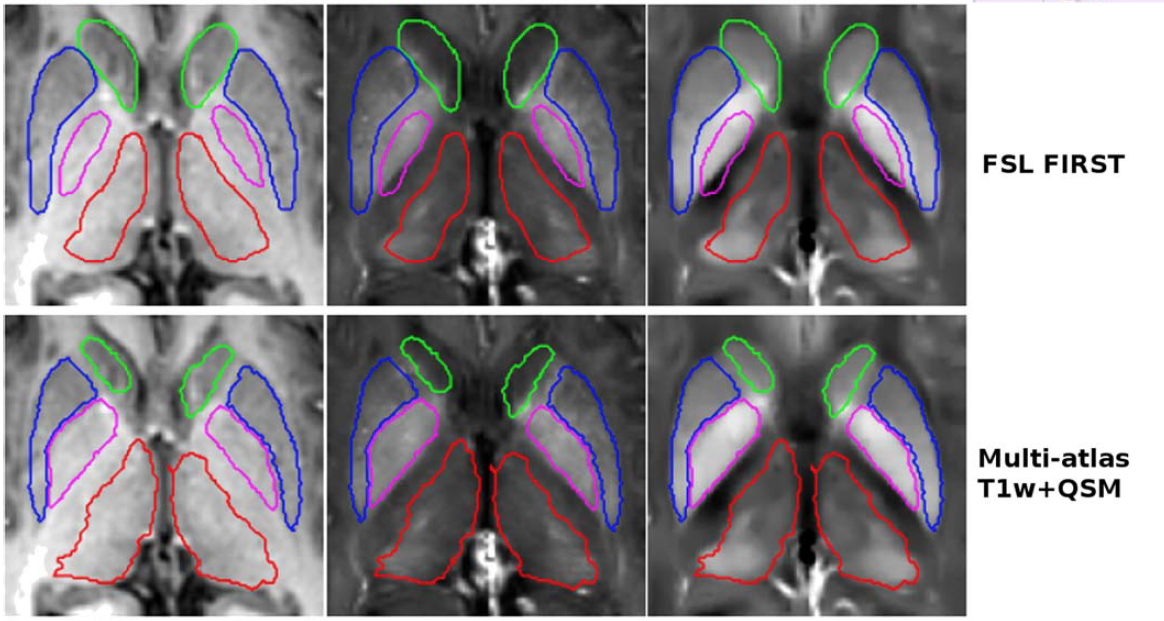
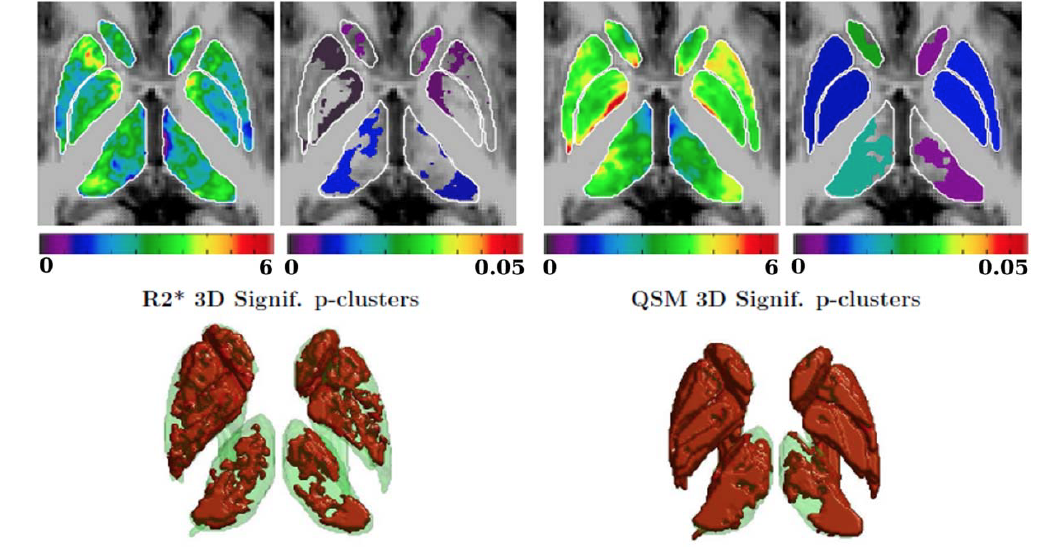
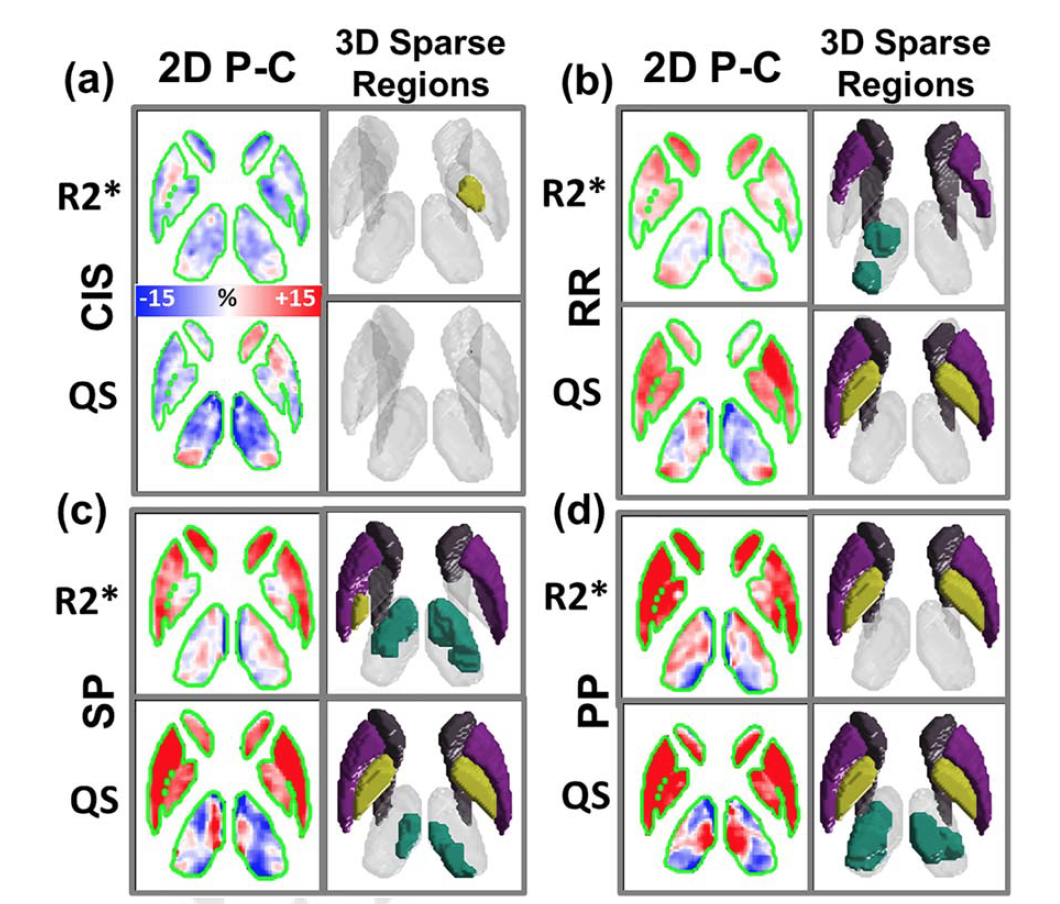
DescriptionWhen using high-field imaging (3.0T or greater), standard brain registration and segmentation methods may perform poorly for some deep GM nuclei due to low T1w contrast, particularly for the globus pallidus and thalamus. But, qualitative imaging, R2* and QSM provide high contrast of iron-rich tissue, that aids segmentation of deep GM. Using 10 in-house multi-modal atlases, we adapted a multi-atlas segmentation method to our high-field data and proved that it outperforms common brain segmentation software like FSL or Freesurfer (JMRI 2015).Using the improved deep gray matter segmentation we performed several population studies related to brain iron accumulation in MS. (JMRI15,Fig2) Sparse classification is used to detect significant discriminative anatomy between healthy controls and MS patients on R2* and QSM images. (JMRI17,Fig3) R2* and QSM data are integrated to detect localized maps of iron/myelin in MS patients relative to controls. (AJN) The relationships between cognition and deep grey matter iron in MS is investigated using two MRI-based iron susceptibility measures.
|