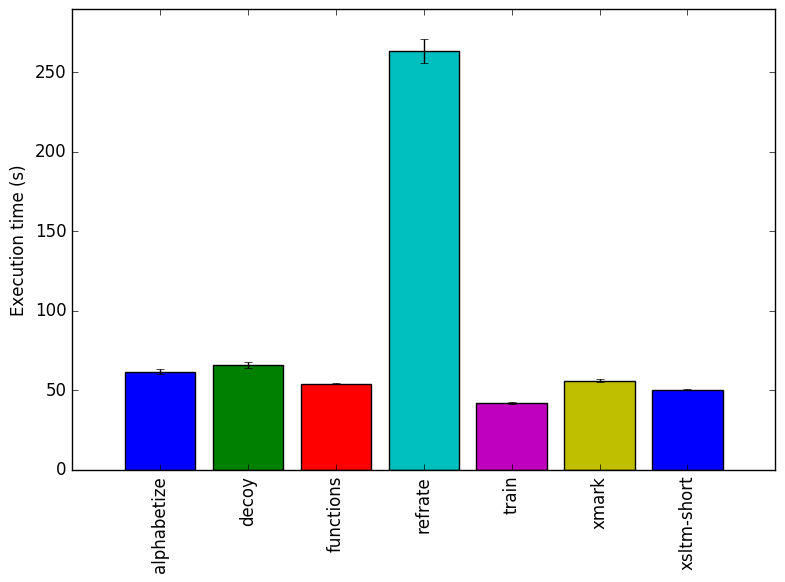
Figure 1: The mean execution time from three
runs for each workload.
This report presents:
Important take-away points from this report:
The 523.xalancbmk_r benchmark is based on the Xalan-C++ project. Xalan an XSLT processor which performs transformations on XML data.
See the SPEC documentation for a description of the input format.
There are a few steps to generate new workloads for the 523.xalancbmk_r benchmark:
For our tests, we created 5 new workloads. The workloads are based on the XSLT benchmarks (XSLTMark and XMark). This data was extracted from the repository for XT-Speedo, a newer XSLT benchmarking framework1. While these XSLT benchmarks should be useful for the observation of variations in the program behaviour, it would be desirable to find more recent sources of XSL transformations to create inputs that may better track current usage of transformations of xml data. For most of the workloads, the original benchmarks from which they are taken run for very short periods of time. As such, we generated new XML files containing significantly more data and in some cases combined multiple workloads into one. The new workloads are described below.
These workloads come from the XSLTMark benchmark. They take as inputs simple XML files containing entries for a number of people. Each entry includes a unique ID, a first and last name, a street name, a city name, a state, and a zip code. We wrote a script to produce random XML files with a given number of entries and used it for all workloads in this category. This script is avalable at https://webdocs.cs.ualberta.ca/~amaral/AlbertaWorkloadsForSPECCPU2017/scripts/523.xalancbmk˙r.scripts.tar.gz .
The alphabetize workload alphabetizes an XML tree. Its XML file contains 150000 entries.
The decoy workload matches patterns. It includes ”decoy” patterns to make matching harder. Note that none of these patterns will likely be matched as the XML file is randomly generated, so this workload should be considered a test of the worst-case scenario for pattern matches. Its XML file contains 30000 entries.
The functions workload performs transformations on name attributes. Its XML file contains 10000 entries.
Lastly, the xsltm-short workload is made up of multiple XSTLMark tests combined into one XSL file. For each entry, it:
Its XML file contains 150000 entries.
The xmark workload is derived from the XMark benchmark. XMark includes 20 short queries, but numbers 9 and 10 require XSLT 2.0, which is not compatible with 523.xalancbmk_r. Thus, this workload combines queries 1-8 and 11-20.
The XML file for this workload contains information about auctions, people and books. It was generated using the public domain xmlgen2tool. Specifically, the tool was run with the following settings:
The included queries do the following:
This section presents an analysis of the workloads for the 523.xalancbmk_r benchmark and their effects on its performance. All of the data in this section was measured using the Linux perf utility and represents the mean value from three runs. In this section, the following questions will be answered:
The simplest metric by which we can compare the various workloads is their execution time. To this end, the benchmark was compiled with GCC 4.8.4. at optimization level -O3, and the execution time was measured for each workload on machines with Intel Core i7-2600 processors at 3.4 GHz and 8 GiB of memory running Ubuntu 14.04 LTS on Linux Kernel 3.16.0-71.
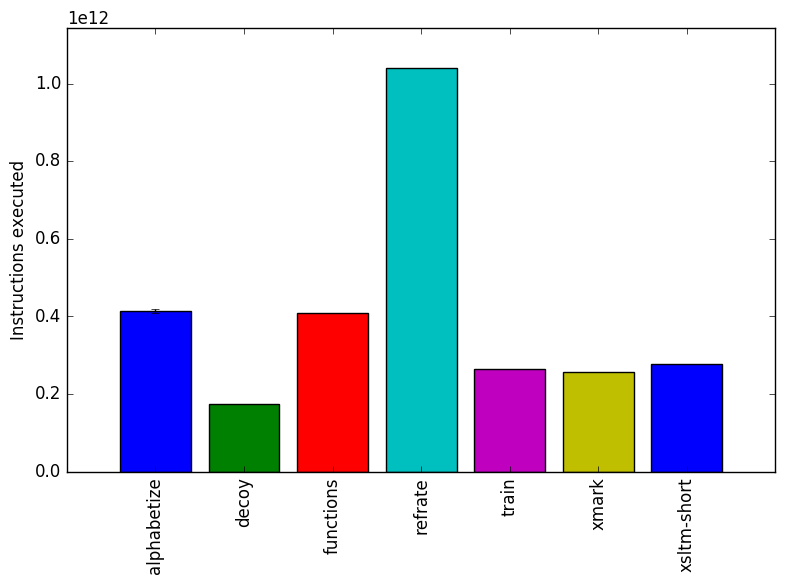
Figure 1 shows the mean execution time for each of the workloads. Most of the workloads have similar runtimes, as increasing the runtimes of the simple XML translations from the XMark and XSLTMark benchmarks would have required extremely large input XML files.
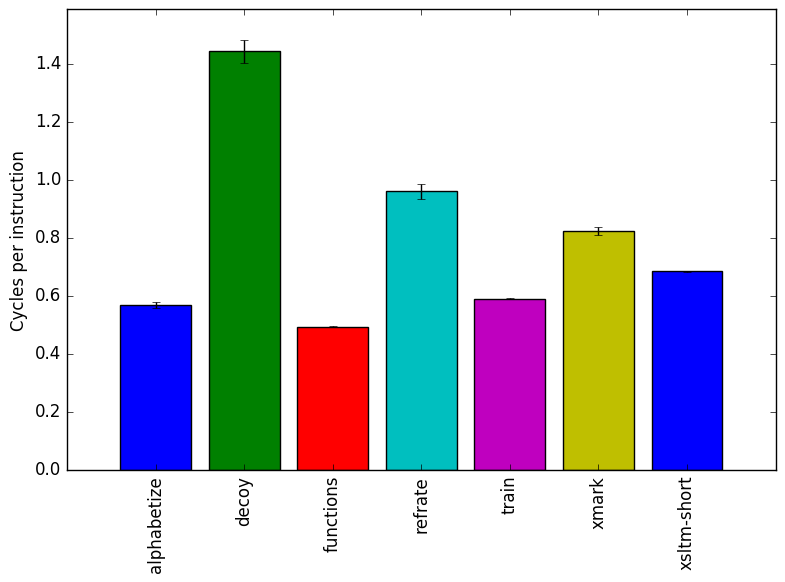
In Figures 2 and 3, we see that the alphabetize and functions workloads use the fewest cycles per instruction (CPI), whereas the decoy workload has a much higher CPI.
This section analyzes which parts of the benchmark are exercised by each of the workloads. To this end, we determined the percentage of execution time the benchmark spends on several of the most time-consuming functions. The full listing of data can be found in the Appendix. This data was recorded on a machine with an Intel Core i5-3210M processor at 3.4 GHz and 8 GiB of memory running Ubuntu 14.04 on Linux Kernel 3.16.0.-71.
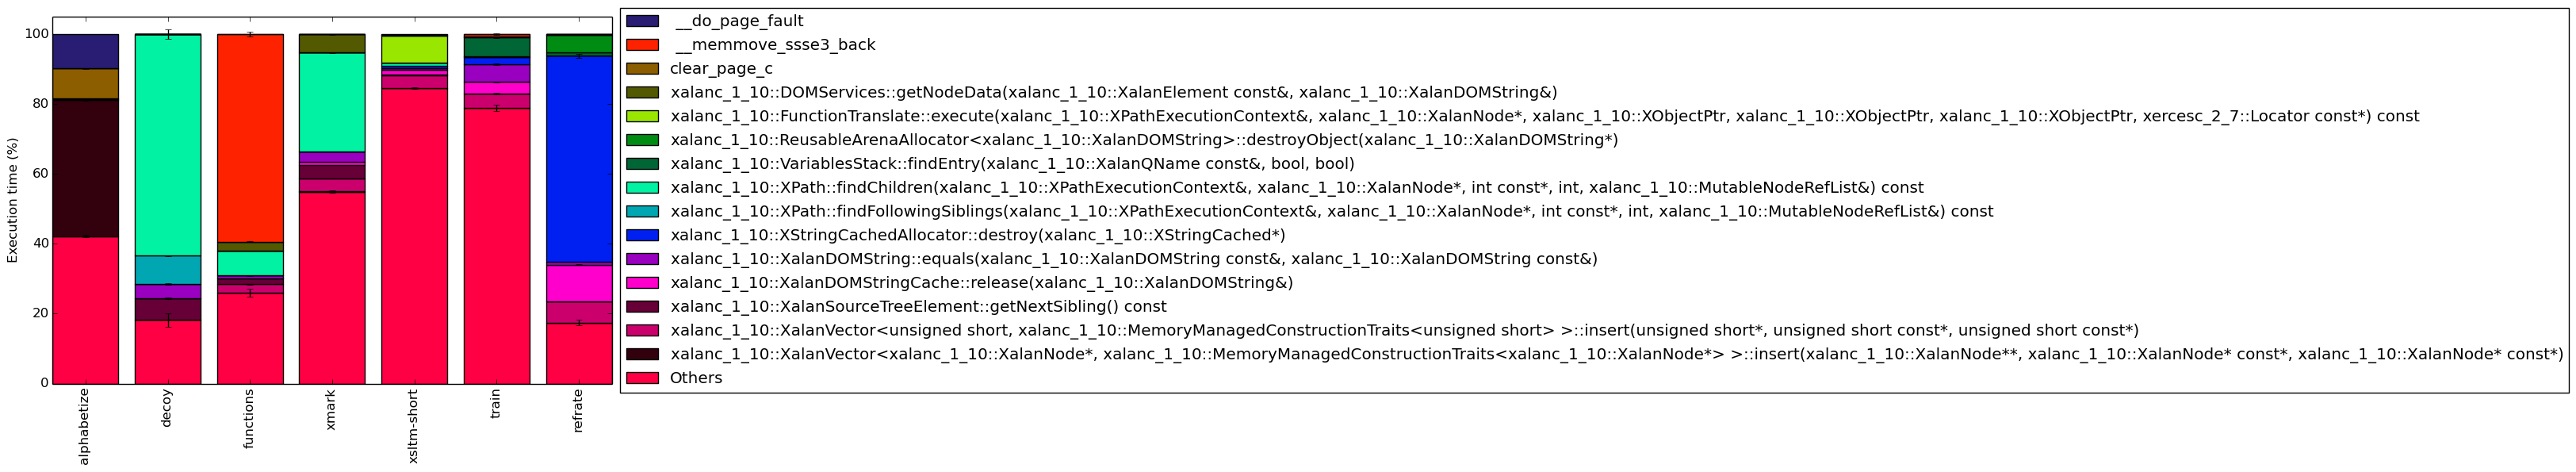
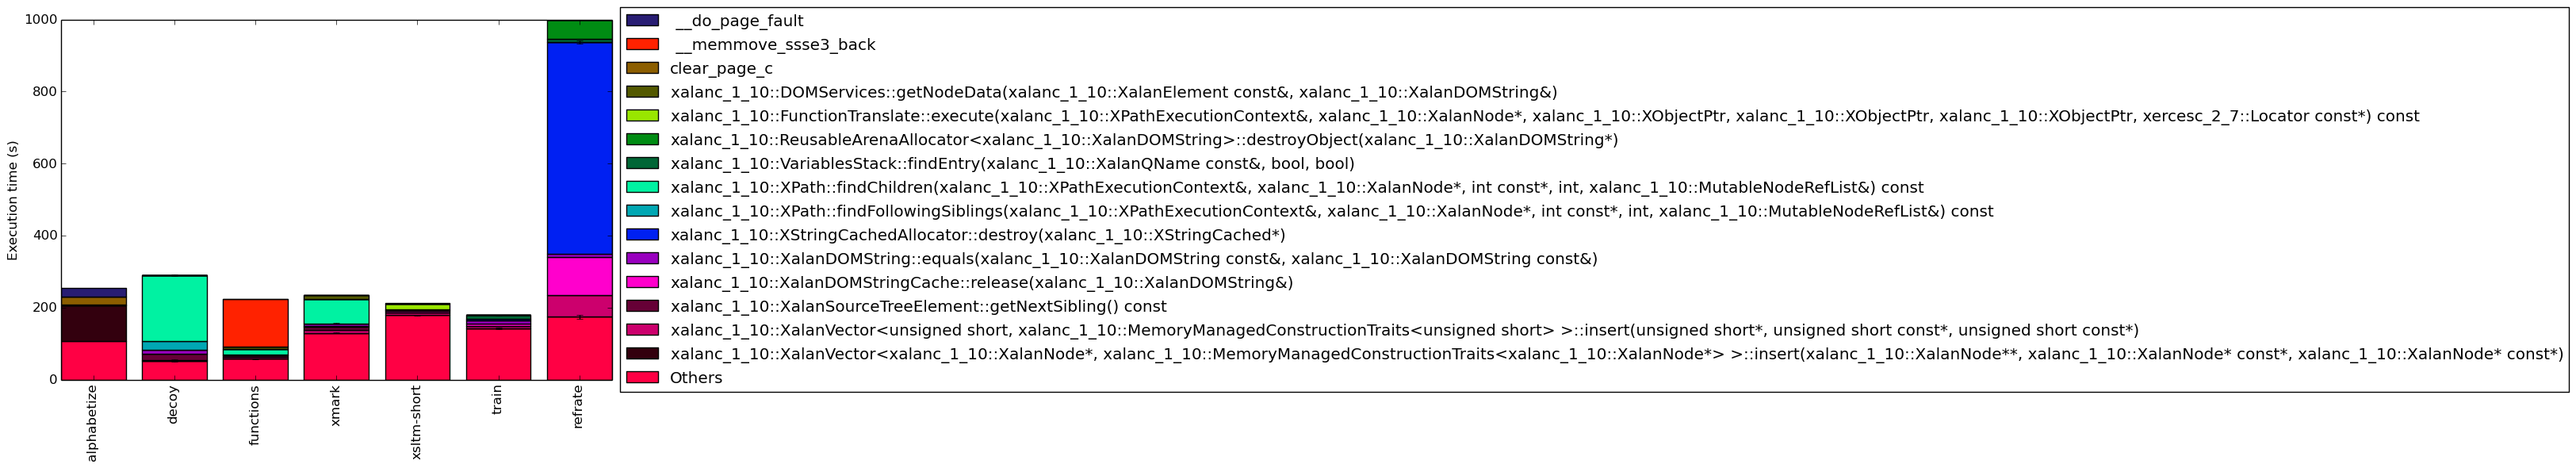
The functions covered in this section are all the functions which made up more than 5% of the execution time for at least one of the workloads. A brief explanation of each function follows:
The full data can be found in Figure 13. To help make this large amount of data easier to compare, Figure 4 condenses the same information into a stacked bar chart, including an “Others” category for any symbols which are not listed in Figure 13. Evidently, depending on the workload, the benchmark’s behaviour can vary greatly, as each of the workloads has a different execution profile.
The alphabetize workload spends a large amount of time on the xalanc_1_10::XalanVector::insert function, which suggests that it makes heavy use of vectors. Also of note is the prevalence of the __clear_page_c and __do_page_fault functions, which indicate that this workload generates many page faults. A large amount of time is also spent in the “others” category, meaning that many different functions are called which never make up more than 5% of the benchmark’s execution time.
On the other hand, decoy spends the majority of its time finding child nodes, followed by functions related to finding sibling nodes. Therefore this workload focuses heavily on navigating XML trees. A small amount of time is also spent comparing strings, which is to be expected in a pattern-matching workload. This workload has the smallest “others” category, which suggests that a lower variety of functions are called.
The functions workload appears to perform a large amount of work with memory, as it spends most of its time in the __memmove_ssse3_back function. The rest of its time appears to be mostly spent navigating the XML tree and getting node data.
The xmark workload exhibits a similar execution profile to that of the decoy workload, albeit with more accesses to node data, no time spent searching through sibling nodes, and more vector insert operations. As well, this workload spends the majority of its time in the “others” category, whereas decoy spent very little. This is likely a result of combining several transformations together, as each transformation results in calls to a different host of “smaller” functions.
The xsltm-short and train workloads spend even more time in the “others” category (around 80% of their time). As suggested in the previous paragraph, this is likely due to the amalgamation of many transformations – in xsltm-short’s case, 18 of them, and in train’s case, presumably a similarly large number.
Finally, the refrate workload spends a large amount of time releasing and destroying cached strings as well as searching for specific value names.
Given the wide variety of behaviours shown in this section, it is likely that there are other parts of the benchmark’s code which are never exercised even with this new set of workloads. Creation of further workloads is recommended. As well, due to the large number of functions being called which are not accounted for in this analysis (that is, ones in the “others” category), further investigation of code coverage should be considered.
In this section, we will first use the Intel “Top-Down” methodology3to see where the processor is spending its time while running the benchmark. This methodology breaks the benchmark’s total execution slots into four high-level classifications:
The event counters used in the formulas to calculate each of these values can be inaccurate. Therefore the information should be considered with some caution. Nonetheless, they provide a broad, generally reasonable overview of the benchmark’s performance.
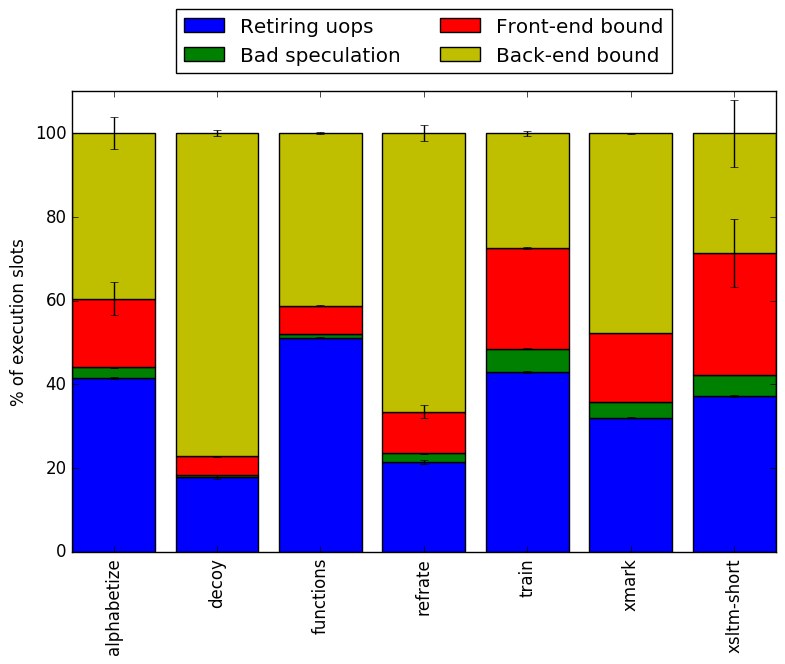
Figure 6 shows the distribution of execution slots spent on each of the aforementioned Top-Down categories. Depending on the workload, the ratio of work is completely different, which confirms that different workloads can exercise the processor in very different ways.
All of the workloads have fairly low bad speculation bounds, which suggests that the branches taken tend to be fairly predictable. The xsltm-short, xmark and train workloads have slightly higher bad speculation bounds (though still less than 10%).
The alphabetize and xmark workloads have a fairly even split between execution slots spent tied up in the back-end and spent retiring operations, with front-end bound taking up only around 20% of the slots. The functions workload has a similar split, but with even fewer slots spent on the front end. The fairly high retiring bound is particularly surprising for functions, as it spends a large amount of time moving data in memory (as shown in Section 4.2), which often results in many cache misses and page faults.
The decoy and refrate workloads are both heavily (70-80%) back-end-bound.
Lastly, the xsltm-short and train workloads have much higher front-end bounds than the others as well as moderately high retiring bounds. However, there is a large amount of variance, so it is unclear whether they are more strongly front- or back-end bound.
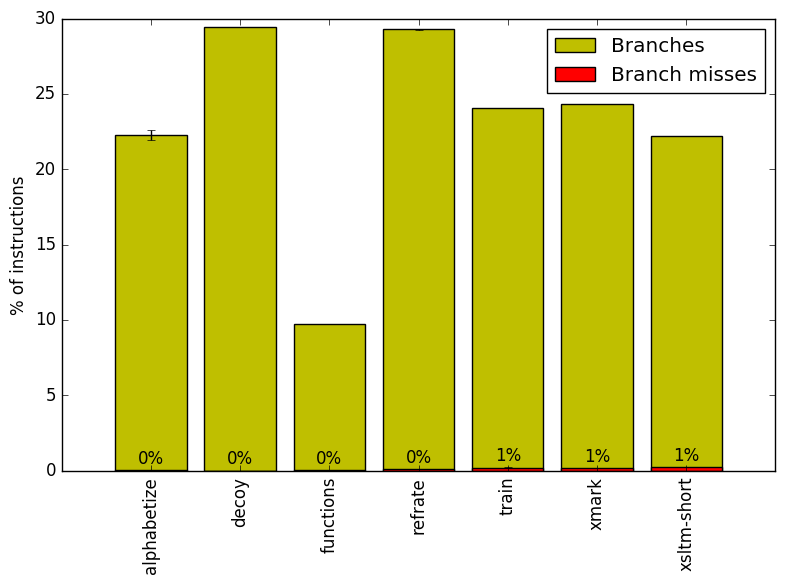
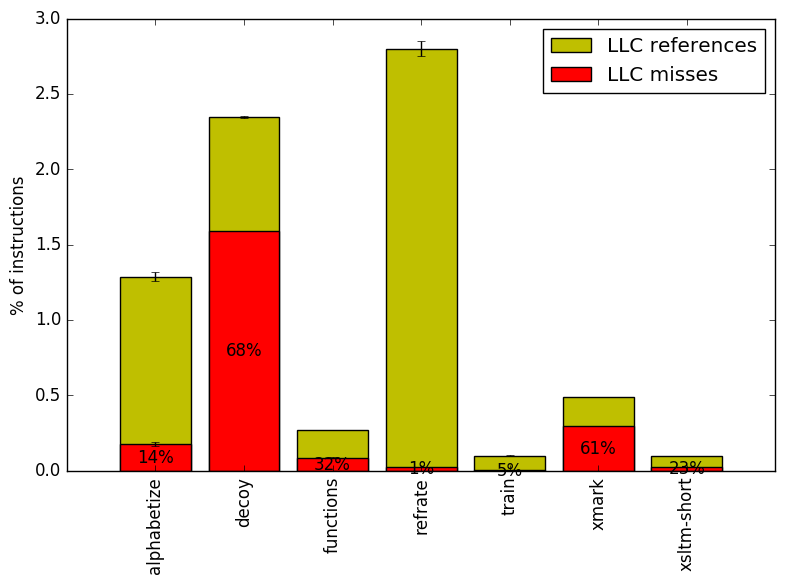
We now analyze cache and branching behaviour more closely. Figures 7 and 8 show, respectively, the rate of branching instructions and last-level cache (LLC) accesses from the same runs as Figure 6. As the benchmark executes a vastly different number of instructions for each workload, which makes comparison between benchmarks difficult, the values shown are rates per instruction executed.
Figure 7 reaffirms that the workloads all have very low branch miss rates. Regardless of the rate of branching, the miss rate remains at 1% or lower.
In contrast, Figure 8 reveals that the workloads have very different cache behaviour. Both functions and xsltm-short have fairly low LLC reference rates, though they also miss the LLC for around one third of those references. The train workload also seldom references the LLC, but it also rarely misses it.
On the other hand, the decoy workload has a high rate of LLC references as well as misses, which explains its high back-end bound. The refrate workload also frequently references the LLC, though it rarely misses. However, given its elevated runtime, the penalty of reaching the LLC clearly adds up, resulting in its almost equally high back-end bound.
This section compares the performance of the benchmark when compiled with either GCC (version 4.8.4); the Clang frontend to LLVM (version 3.6); or the Intel ICC compiler (version 16.0.3). To this end, the benchmark was compiled with all three compilers at six optimization levels (-O{0-3}, -Os and -Ofast), resulting in 18 different executables. Each workload was then run 3 times with each executable on the Intel Core i7-2600 machines described earlier.
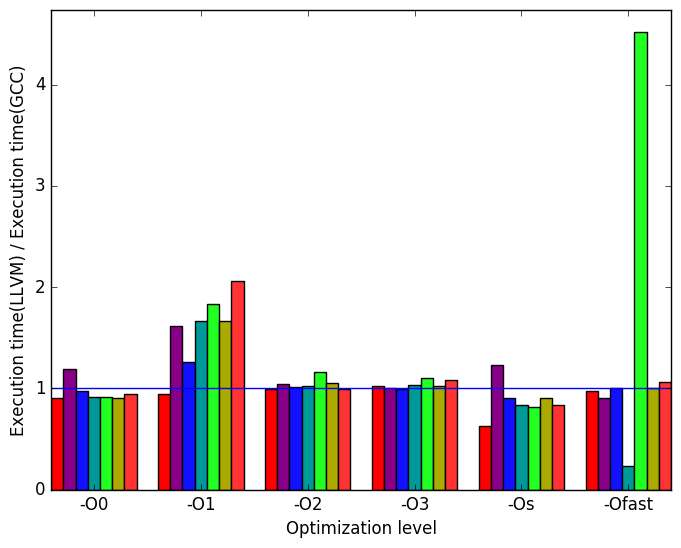
First, we compare GCC to LLVM. There are a few notable differences in their behaviour, the most prominent of which are highlighted in Figure 9.
Figure 10a shows that the execution times are generally similar, though GCC takes a clear lead over LLVM at level -O1. LLVM also appears to struggle with the train workload at level -Ofast. However, the LLVM -Ofast version processes the refrate workload in a fraction of the time as the equivalent GCC version.
Figure 10b demonstrates that the spikes and pits seen in Figure 10a can largely be explained by increases or decreases in instruction count for LLVM.
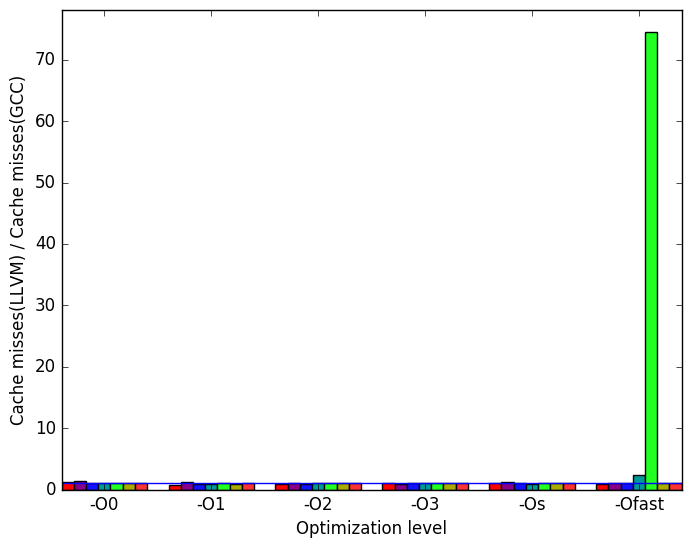
Figure 10c reveals that at level -Ofast and with workload train, the LLVM version of the benchmark produces nearly 80 times as many cache misses as GCC.
Figure 10d shows further spikes in data translation lookaside buffer (dTLB) misses for the LLVM code. Once again, train appears to be problematic, specifically at level -Ofast. The workload functions also has more dTLB misses in LLVM than in GCC across optimization levels -O2, -O3, -Os, -Ofast.
 (a)
relative
execution
time
(a)
relative
execution
time 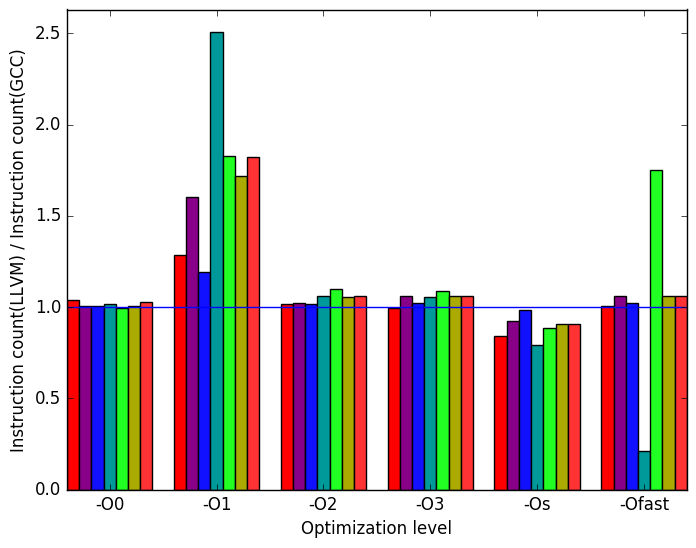 (b)
instructions
(b)
instructions
 (c)
cache
misses
(c)
cache
misses 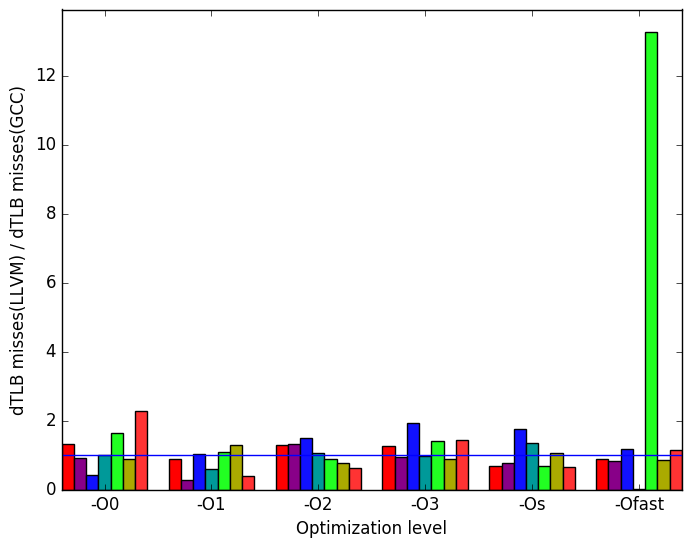 (d)
dTLB
misses
(load
and
store
combined)
(d)
dTLB
misses
(load
and
store
combined)
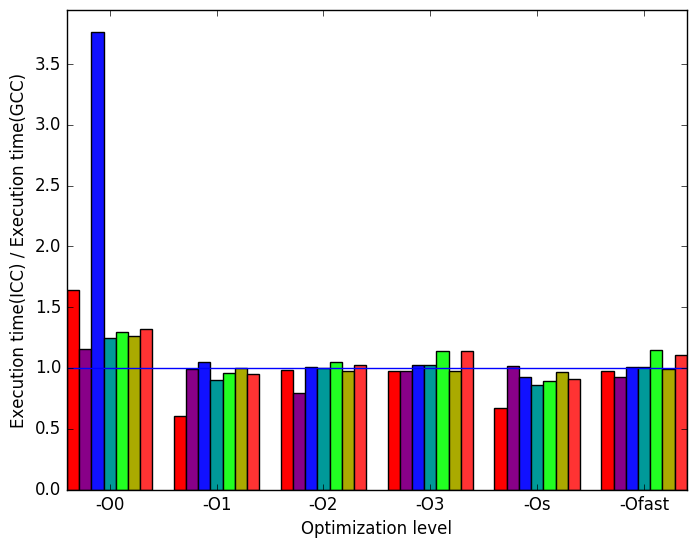
Once again, the most prominent differences between the ICC- and GCC- generated code are highlighted in Figure 11.
Figure 12a shows that ICC performs very poorly at level -O0 for the functions workload. There is also an approximately 1.5 times increase in execution time for the alphabetize workload at optimization level -O0
In Figure 12b, we can see that the increases in alphabetizes’ runtimes are at least partly explained by corresponding increases in instruction count. Strangely, the ICC -O0 benchmark actually executes fewer instructions for the functions workload despite its increased execution time.
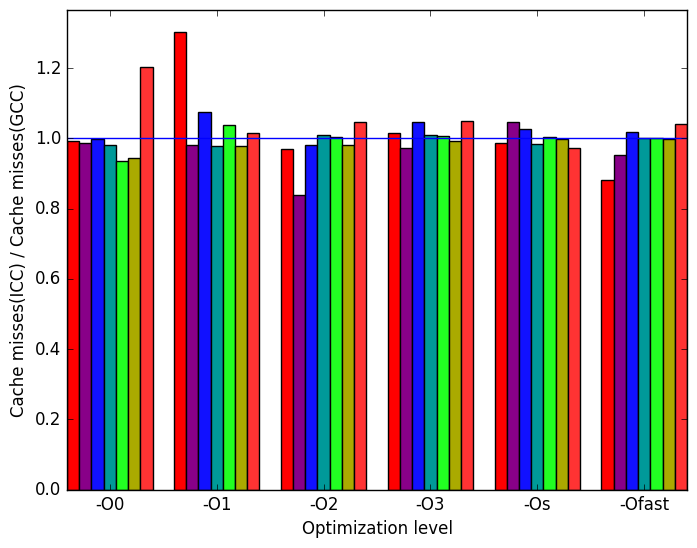
Figure 12c reveals that ICC produces a similar amount of cache misses compared with GCC.
Finally, Figure 12d demonstrates that ICC causes dTLB misses to rise considerably for different workloads at different optimization levels. For example: at optimization level -O2 the workload functions generates 2.5 times more the amount of dTLB misses than the when it is run on GCC. But for most of the optimization levels ICC generates executables with less dTLB misses than gcc. There is no discernible pattern.
 (a)
relative
execution
time
(a)
relative
execution
time 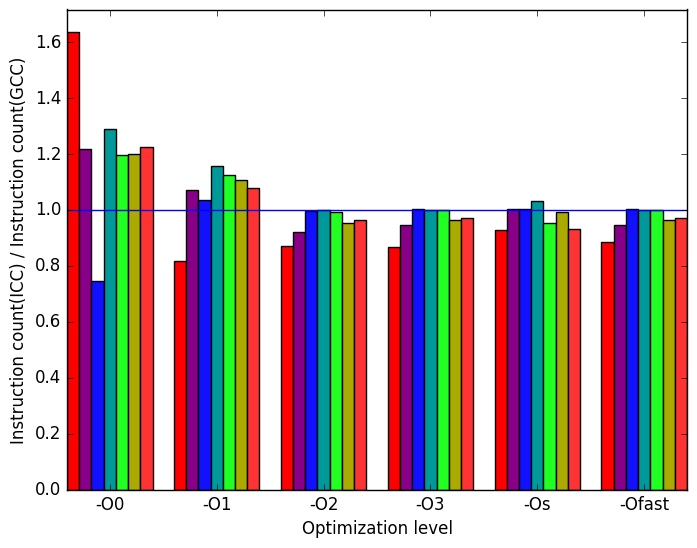 (b)
instructions
(b)
instructions
 (c)
cache
misses
(c)
cache
misses 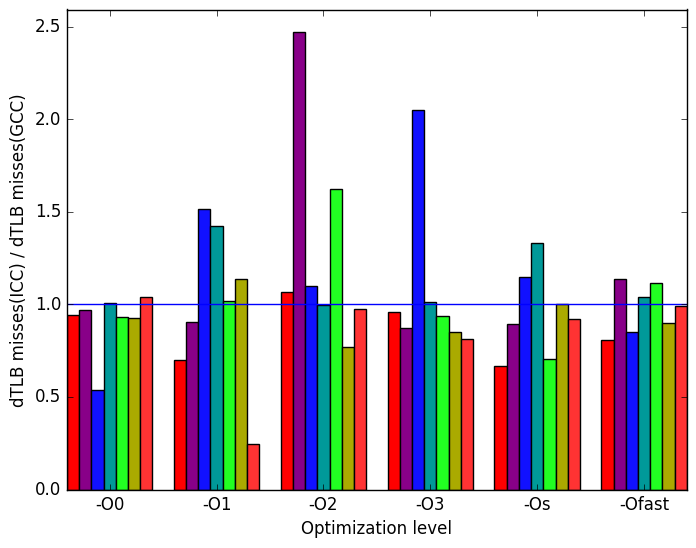 (d)
dTLB
misses
(load
and
store
combined)
(e)
Legend
for all
the
graphs
in
Figures ??
and
??
(d)
dTLB
misses
(load
and
store
combined)
(e)
Legend
for all
the
graphs
in
Figures ??
and
??
The 523.xalancbmk_r benchmark’s behaviour varies greatly depending on its inputs. The addition of 5 new workloads revealed many portions of the code which were rarely if ever visited by train and refrate. Producing further inputs for this benchmark would be beneficial, as it would allow even more of its code to be exercised. The benchmark also appears to execute a large number of short functions which were not thoroughly investigated in our analysis. As such, different metrics could be used to more clearly determine how well the code is covered.
| Symbol | Time Spent (geost) |
| xalanc_1_10:: | |
| XalanVector::insert | 39.14 (1.01) |
| xalanc_1_10:: | |
| XalanSourceTreeElement:: | |
| getNextSibling | 0.01 (1.00) |
| xalanc_1_10:: | |
| XalanDOMStringCache:: | |
| release | 0.05 (1.00) |
| xalanc_1_10:: | |
| XalanDOMString:: | |
| equals | 0.08 (1.00) |
| xalanc_1_10:: | |
| XStringCachedAllocator:: | |
| destroy | 0.00 (1.00) |
| xalanc_1_10::XPath:: | |
| findFollowingSiblings | 0.00 (1.00) |
| xalanc_1_10:: | |
| XPath::findChildren | 0.11 (1.00) |
| xalanc_1_10:: | |
| VariablesStack:: | |
| findEntry | 0.00 (1.00) |
| xalanc_1_10:: | |
| ReusableArenaAllocator:: | |
| destroyObject | 0.00 (1.00) |
| xalanc_1_10:: | |
| FunctionTranslate:: | |
| execute | 0.00 (1.00) |
| xalanc_1_10:: | |
| DOMServices::getNodeData | 0.03 (1.01) |
| clear_page_c | 8.61 (1.01) |
| __memmove_ | |
| ssse3_back | 0.02 (1.00) |
| __do_page_fault | 9.78 (1.01) |
| Symbol | Time Spent (geost) |
| xalanc_1_10:: | |
| XalanVector::insert | 0.04 (1.01) |
| xalanc_1_10:: | |
| XalanSourceTreeElement:: | |
| getNextSibling | 6.19 (1.03) |
| xalanc_1_10:: | |
| XalanDOMStringCache:: | |
| release | 0.02 (1.01) |
| xalanc_1_10:: | |
| XalanDOMString:: | |
| equals | 3.96 (1.07) |
| xalanc_1_10:: | |
| XStringCachedAllocator:: | |
| destroy | 0.00 (1.00) |
| xalanc_1_10::XPath:: | |
| findFollowingSiblings | 8.16 (1.01) |
| xalanc_1_10:: | |
| XPath::findChildren | 63.37 (1.02) |
| xalanc_1_10:: | |
| VariablesStack:: | |
| findEntry | 0.00 (1.00) |
| xalanc_1_10:: | |
| ReusableArenaAllocator:: | |
| destroyObject | 0.00 (1.00) |
| xalanc_1_10:: | |
| FunctionTranslate:: | |
| execute | 0.00 (1.00) |
| xalanc_1_10:: | |
| DOMServices::getNodeData | 0.05 (1.01) |
| clear_page_c | 0.00 (1.00) |
| __memmove_ | |
| ssse3_back | 0.00 (1.00) |
| __do_page_fault | 0.00 (1.00) |
| Symbol | Time Spent (geost) |
| xalanc_1_10:: | |
| XalanVector::insert | 2.42 (1.04) |
| xalanc_1_10:: | |
| XalanSourceTreeElement:: | |
| getNextSibling | 1.51 (1.01) |
| xalanc_1_10:: | |
| XalanDOMStringCache:: | |
| release | 0.00 (1.00) |
| xalanc_1_10:: | |
| XalanDOMString:: | |
| equals | 0.99 (1.11) |
| xalanc_1_10:: | |
| XStringCachedAllocator:: | |
| destroy | 0.00 (1.00) |
| xalanc_1_10::XPath:: | |
| findFollowingSiblings | 0.00 (1.00) |
| xalanc_1_10:: | |
| XPath::findChildren | 7.03 (1.01) |
| xalanc_1_10:: | |
| VariablesStack:: | |
| findEntry | 0.00 (1.00) |
| xalanc_1_10:: | |
| ReusableArenaAllocator:: | |
| destroyObject | 0.00 (1.00) |
| xalanc_1_10:: | |
| FunctionTranslate:: | |
| execute | 0.01 (1.01) |
| xalanc_1_10:: | |
| DOMServices::getNodeData | 3.40 (1.04) |
| clear_page_c | 0.00 (1.01) |
| __memmove_ | |
| ssse3_back | 59.40 (1.01) |
| __do_page_fault | 0.00 (1.00) |
| Symbol | Time Spent (geost) |
| xalanc_1_10:: | |
| XalanVector::insert | 6.17 (1.00) |
| xalanc_1_10:: | |
| XalanSourceTreeElement:: | |
| getNextSibling | 0.00 (1.00) |
| xalanc_1_10:: | |
| XalanDOMStringCache:: | |
| release | 10.46 (1.01) |
| xalanc_1_10:: | |
| XalanDOMString:: | |
| equals | 0.86 (1.01) |
| xalanc_1_10:: | |
| XStringCachedAllocator:: | |
| destroy | 58.91 (1.01) |
| xalanc_1_10::XPath:: | |
| findFollowingSiblings | 0.00 (1.00) |
| xalanc_1_10:: | |
| XPath::findChildren | 0.04 (1.00) |
| xalanc_1_10:: | |
| VariablesStack:: | |
| findEntry | 0.86 (1.01) |
| xalanc_1_10:: | |
| ReusableArenaAllocator:: | |
| destroyObject | 5.19 (1.01) |
| xalanc_1_10:: | |
| FunctionTranslate:: | |
| execute | 0.00 (1.00) |
| xalanc_1_10:: | |
| DOMServices::getNodeData | 0.01 (1.01) |
| clear_page_c | 0.01 (1.00) |
| __memmove_ | |
| ssse3_back | 0.10 (1.01) |
| __do_page_fault | 0.01 (1.00) |
| Symbol | Time Spent (geost) |
| xalanc_1_10:: | |
| XalanVector::insert | 4.37 (1.06) |
| xalanc_1_10:: | |
| XalanSourceTreeElement:: | |
| getNextSibling | 0.01 (1.00) |
| xalanc_1_10:: | |
| XalanDOMStringCache:: | |
| release | 3.33 (1.01) |
| xalanc_1_10:: | |
| XalanDOMString:: | |
| equals | 5.05 (1.05) |
| xalanc_1_10:: | |
| XStringCachedAllocator:: | |
| destroy | 2.19 (1.03) |
| xalanc_1_10::XPath:: | |
| findFollowingSiblings | 0.00 (1.00) |
| xalanc_1_10:: | |
| XPath::findChildren | 0.13 (1.01) |
| xalanc_1_10:: | |
| VariablesStack:: | |
| findEntry | 5.51 (1.04) |
| xalanc_1_10:: | |
| ReusableArenaAllocator:: | |
| destroyObject | 0.07 (1.01) |
| xalanc_1_10:: | |
| FunctionTranslate:: | |
| execute | 0.00 (1.00) |
| xalanc_1_10:: | |
| DOMServices::getNodeData | 0.09 (1.00) |
| clear_page_c | 0.04 (1.01) |
| __memmove_ | |
| ssse3_back | 0.67 (1.28) |
| __do_page_fault | 0.04 (1.01) |
| Symbol | Time Spent (geost) |
| xalanc_1_10:: | |
| XalanVector::insert | 3.72 (1.01) |
| xalanc_1_10:: | |
| XalanSourceTreeElement:: | |
| getNextSibling | 3.83 (1.01) |
| xalanc_1_10:: | |
| XalanDOMStringCache:: | |
| release | 1.06 (1.01) |
| xalanc_1_10:: | |
| XalanDOMString:: | |
| equals | 2.88 (1.03) |
| xalanc_1_10:: | |
| XStringCachedAllocator:: | |
| destroy | 0.00 (1.00) |
| xalanc_1_10::XPath:: | |
| findFollowingSiblings | 0.00 (1.00) |
| xalanc_1_10:: | |
| XPath::findChildren | 28.34 (1.00) |
| xalanc_1_10:: | |
| VariablesStack:: | |
| findEntry | 0.00 (1.00) |
| xalanc_1_10:: | |
| ReusableArenaAllocator:: | |
| destroyObject | 0.00 (1.00) |
| xalanc_1_10:: | |
| FunctionTranslate:: | |
| execute | 0.00 (1.00) |
| xalanc_1_10:: | |
| DOMServices::getNodeData | 5.93 (1.02) |
| clear_page_c | 0.02 (1.01) |
| __memmove_ | |
| ssse3_back | 0.00 (1.00) |
| __do_page_fault | 0.01 (1.00) |
| Symbol | Time Spent (geost) |
| xalanc_1_10:: | |
| XalanVector::insert | 4.24 (1.01) |
| xalanc_1_10:: | |
| XalanSourceTreeElement:: | |
| getNextSibling | 0.16 (1.02) |
| xalanc_1_10:: | |
| XalanDOMStringCache:: | |
| release | 1.33 (1.01) |
| xalanc_1_10:: | |
| XalanDOMString:: | |
| equals | 0.59 (1.06) |
| xalanc_1_10:: | |
| XStringCachedAllocator:: | |
| destroy | 0.55 (1.05) |
| xalanc_1_10::XPath:: | |
| findFollowingSiblings | 0.00 (1.00) |
| xalanc_1_10:: | |
| XPath::findChildren | 1.02 (1.01) |
| xalanc_1_10:: | |
| VariablesStack:: | |
| findEntry | 0.00 (1.00) |
| xalanc_1_10:: | |
| ReusableArenaAllocator:: | |
| destroyObject | 0.00 (1.00) |
| xalanc_1_10:: | |
| FunctionTranslate:: | |
| execute | 7.67 (1.01) |
| xalanc_1_10:: | |
| DOMServices::getNodeData | 0.58 (1.01) |
| clear_page_c | 0.17 (1.00) |
| __memmove_ | |
| ssse3_back | 0.00 (1.00) |
| __do_page_fault | 0.14 (1.01) |
1https://github.com/Saxonica/XT-Speedo
2http://www.xml-benchmark.org/downloads.html
3More information can be found in §B.3.2 of the Intel 64 and IA-32 Architectures Optimization Reference Manual