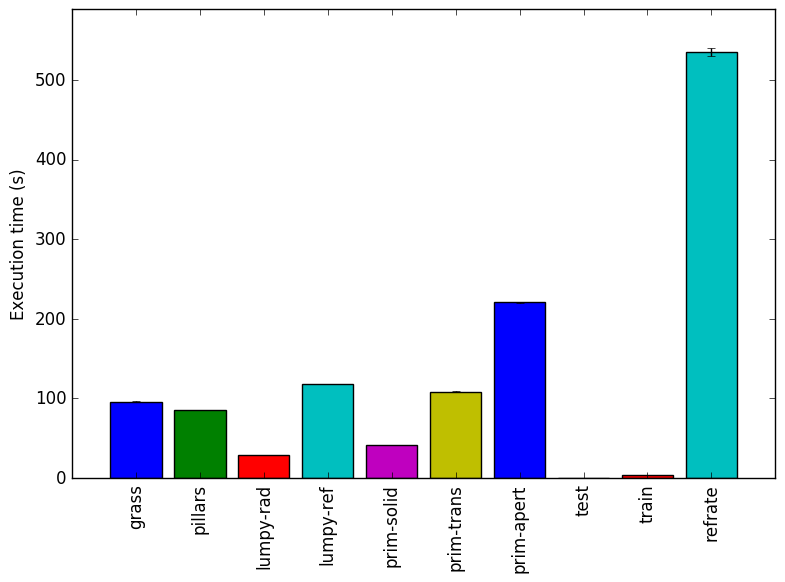
Figure 1: The mean execution time from three
runs for each workload.
This report presents:
Important take-away points from this report:
The 511.povray_r benchmark is a 3D raytracer written in C++.
See Section ?? for a description of the input format.
There are a few steps to generate new workloads for the 511.povray_r benchmark:
For our tests, we created 7 workloads. Each workload aims to test to exercise different portions of the program by including different rendering methods and parameters. The new workloads can be organized into three categories, as detailed in the following subsections.
These workloads are both from the POV-Ray object collection1 and licensed under the terms of the CC-GNU LGPL2. They were chosen to represent real-world uses of POV-Ray.
The grass workload renders a patch of grass at 640x480 resolution. It is notable for spending a large amount of time constructing its mesh before rendering begins, as it is made up of many smaller rectangles (blades of grass).
The pillars workload renders three pillars with various column, capital and base shapes at 320x240 resolution. It also has radiosity3(a shading technique) enabled with a recursion limit of 5. It is an example of rendering moderately complex geometry made up of simple primitives.
These workloads both render a single object placed over a checkered plane and illuminated by two spotlights. The objects are made up of isosurfaces, which are special surfaces in POV-Ray that are described by a mathematical equation. As a result, these workloads tend to put more stress on the processor’s floating-point unit, as rendering isosurface geometry involves calculating an equation’s value for many different points.
The lumpy-ref workload is a smooth, lumpy and translucent object rendered at 320x240 resolution. Primarily, this workload tests the interaction between isosurfaces and refraction.
The lumpy-rad workload uses the same base shape and resolution as lumpy-ref, but increases the intensity of the pits on its surfaces. Further, refraction is disabled, while radiosity is enabled with a recursion limit of 2. Primarily, this workload tests the interaction between isosurfaces and radiosity, which is noted in the POV-Ray documentation4 as being particularly slow.
These workloads render some geometric primitives which are built into POV-Ray (a sphere, a cylinder and a torus). They use the same plane, spotlights and radiosity settings as the lumpy-rad workload. POV-Ray calculates the shapes of built-in primitives fairly quickly, so most of the focus in these workloads is on the rendering techniques being used.
The prim-solid workload renders the primitives at 1440x1080 pixels. The objects are all solid, shiny and slightly reflective. This workload primarily tests the performance of POV-Ray’s reflections.
The prim-trans workload renders the primitives at 960x720 pixels. The objects are the same as in prim-solid, except that they are translucent and have refraction enabled. This workload is intended for comparison to the prim-solid workload to determine the effect of refraction on the benchmark’s behaviour.
Finally, the prim-apert workload renders the primitives at 160x120 pixels. It uses the same settings as prim-trans except that it gives the camera an aperture of 0.1, a confidence of 0.99 and a variance of 0. As such, rays must be continually fired at slightly different angles for each pixel until there is a 99% chance that it is exactly the correct color, significantly slowing down rendering. Thus, the workload is rendered at a much smaller resolution. This workload primarily tests the effect of camera lens aperture.
This section presents an analysis of the workloads for the 511.povray_r benchmark and their effects on its performance. All of the data in this section was measured using the Linux perf utility and represents the mean value from three runs. In this section, the following questions will be answered:
The simplest metric by which we can compare the various workloads is their execution time. To this end, the benchmark was compiled with GCC 4.8.2 at optimization level -O3, and the execution time was measured for each workload on machines with Intel Core i7-2600 processors at 3.4 GHz and 8 GiB of memory running Ubuntu 14.04 LTS on Linux Kernel 3.16.0-71-generic. Figure 1 shows the mean execution time for each of the workloads.
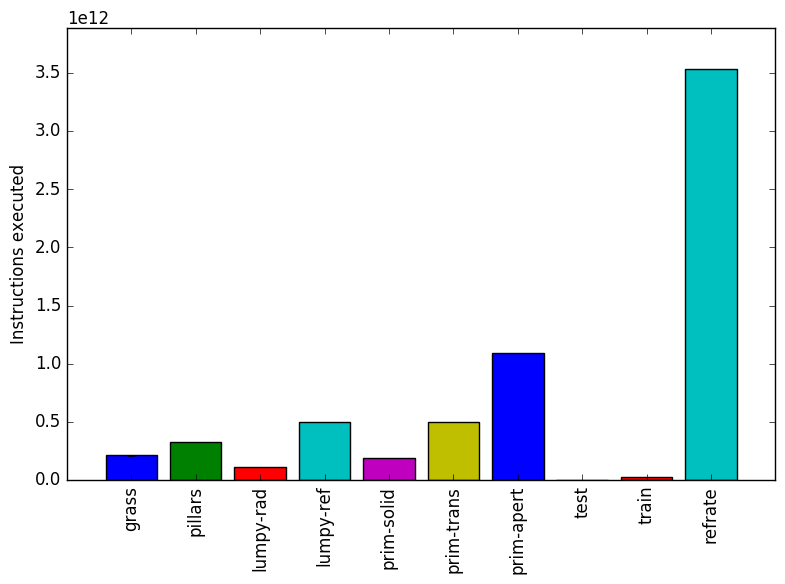
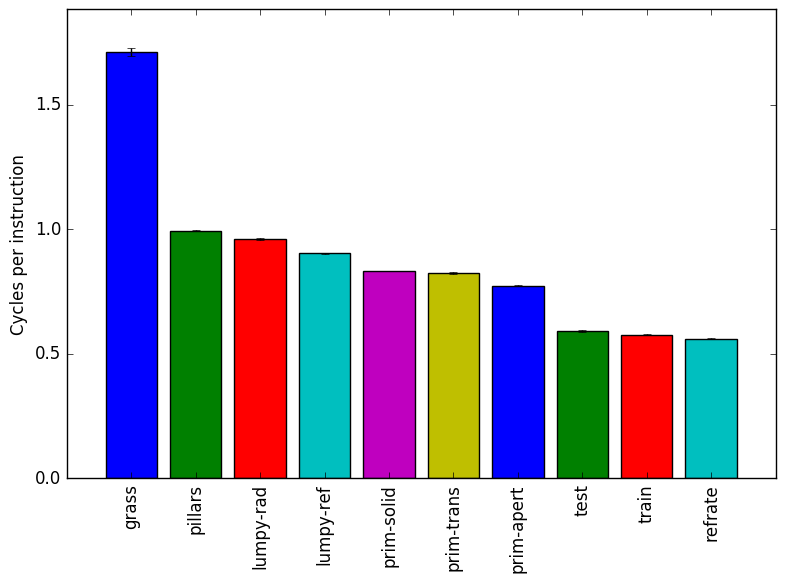
As shown in Figure 1, the grass and pillars workloads both take around 100 seconds to execute. However, the grass workload actually causes far fewer instructions to execute than the pillars workload. This is explained by its extremely high cycles per instruction (CPI) which, as shown in Figure 3, more than doubles the CPI of many other workloads.
The lumpy-rad workload takes much less time and executes far fewer instructions than the lumpy-ref workload. This suggests that, at least for isosurfaces, refraction in a smooth surface is considerable more processor-intensive than calculating radiosity for a complicated, crinkly surface.
We also see the progressively larger execution times of the prim-* workloads, as one would expect for workloads that progressively use more program features. Note that prim-trans renders at a lower resolution than prim-solid, and prim-apert in turns renders at a much lower resolution than prim-trans, so the differences in their execution times are actually less pronounced than they would be if the workloads were at the same resolution.
Lastly, we see the train and refrate workloads have extremely different execution times, with train having an extremely short execution time ( 15s) and refrate having an extremely long one ( 550s). This may be problematic, as the wiki page for povray5indicates that the train workload should run for 10% to 25% as long as refrate, when in fact it runs closer to 3% as long. Also of note is that their mean CPIs are nearly identical, suggesting that the two workloads may be performing very similar work.
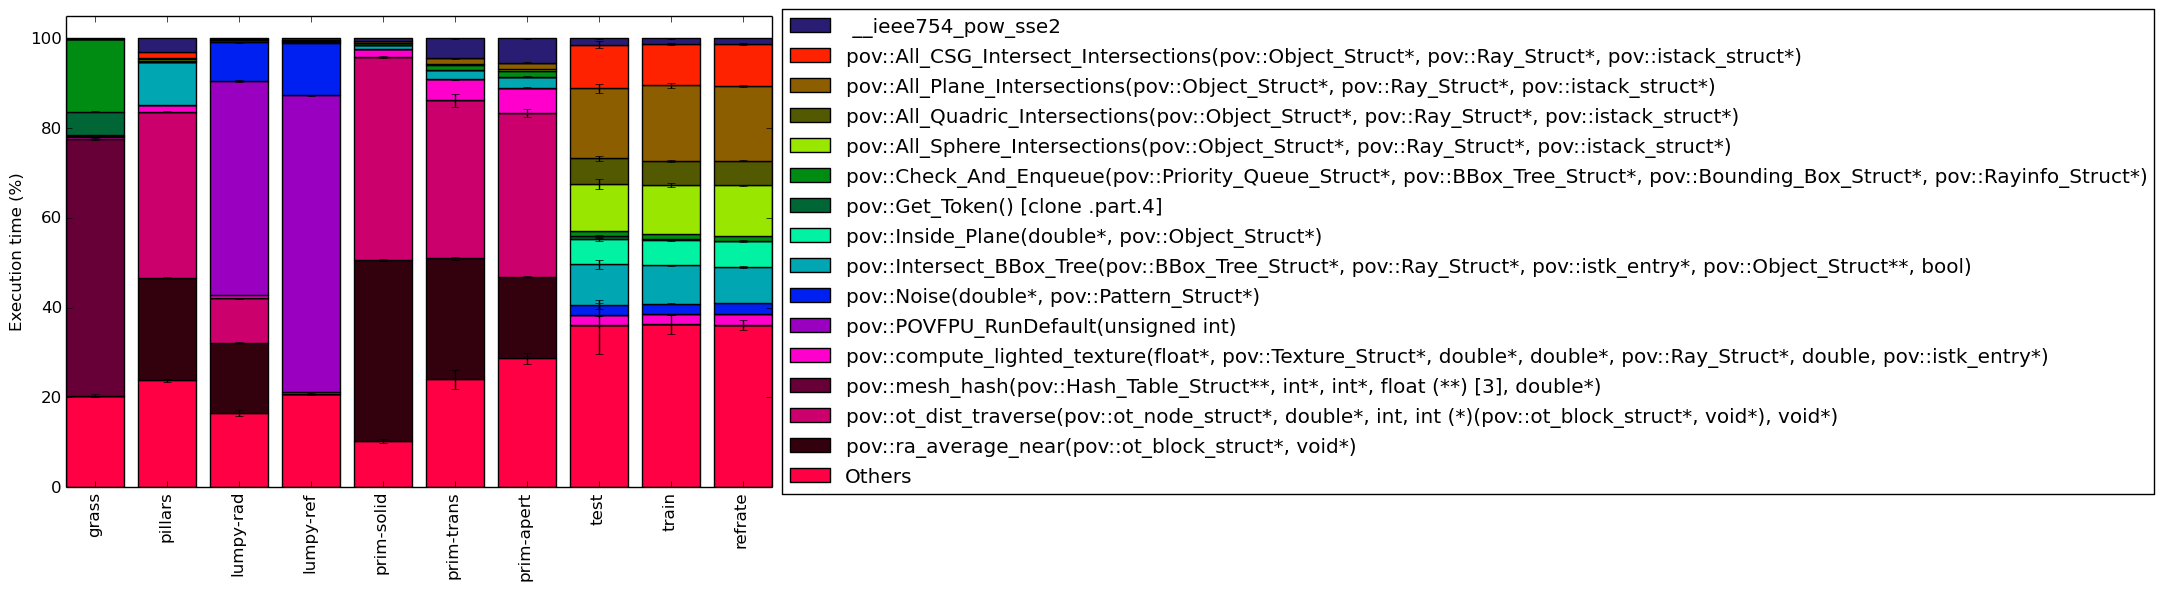
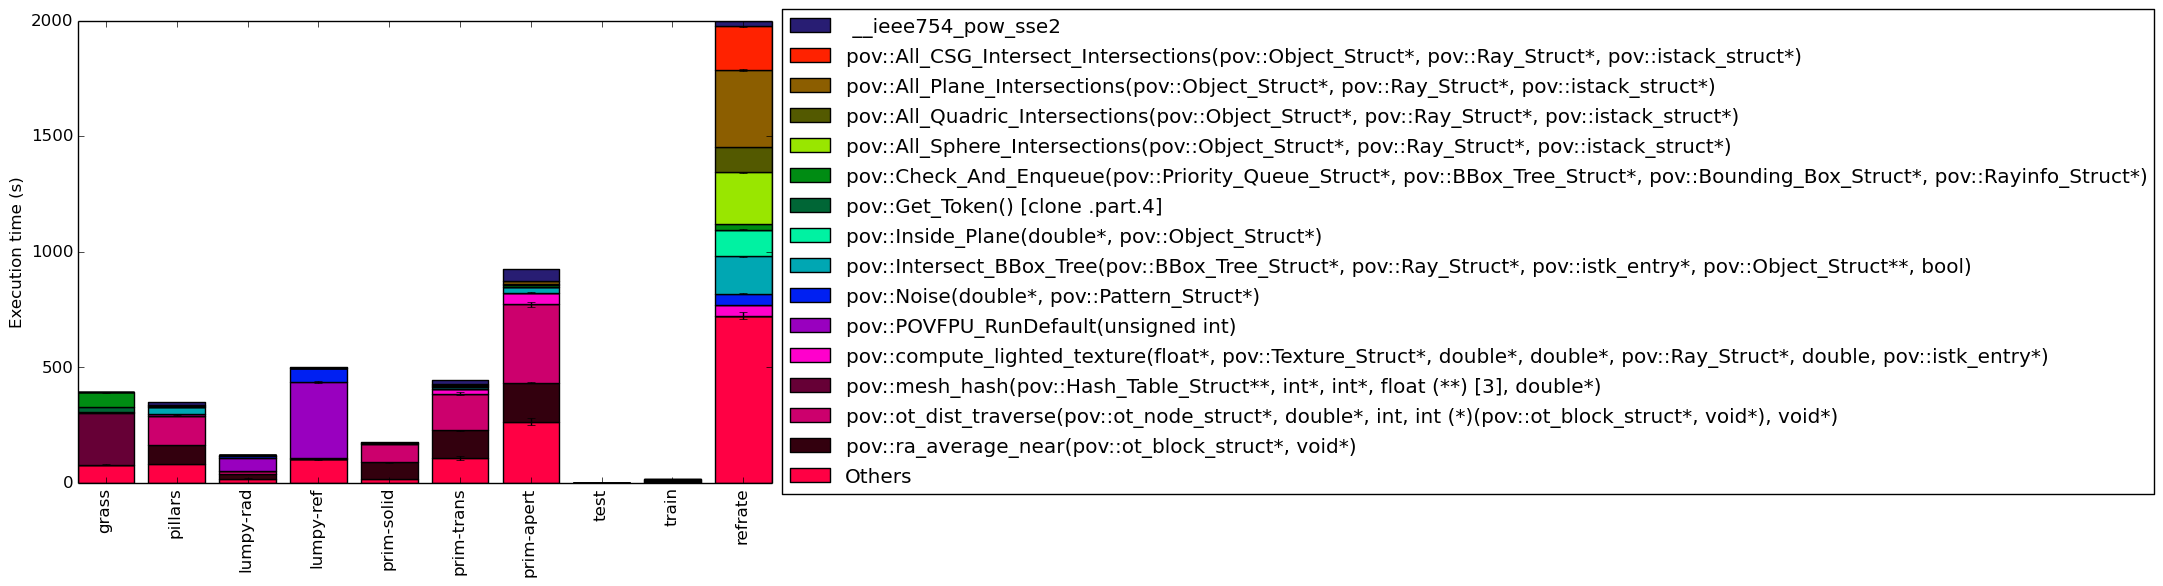
This section analyzes which parts of the benchmark are exercised by each of the workloads. To this end, we determined the percentage of execution time the benchmark spends on several of the most time-consuming functions.
The functions covered in this section are all the functions which made up more than 5% of the execution time for at least one of the workloads. A brief explanation of each function follows:
Figure 5 shows a coverage graph as a stacked bar graph. Evidently, depending on the workload, the benchmark’s behaviour can vary greatly. We can roughly categorize these workloads by the similarities in their behaviour. Figure 4 shows the same inforamtion as a percentage of the total execution time.
The grass workload stands alone as the sole workload to make extensive use of the pov::mesh_hash function, and to a lesser extent, the pov::Check_And_Enqueue and pov::Get_Token functions. This is likely due to the workload’s extreme focus on meshes, while the other workloads make use of primitives and isosurfaces.
The pillars, prim-solid, prim-trans and prim-apert benchmarks spend most of their time on the pov::ot_dist_traverse and pov::ra_average_near functions, both of which are related to radiosity. The longer-running workloads tend to increase the size of the “Others” category and slightly increase the execution time for the functions near the top of the chart. Thus, the addition of refraction and/or camera aperture effects appears to result in a few more calls to many different functions rather than many more calls to a few functions. Overall, this does not completely change the program’s behaviour, as the majority of execution time is still spent calculating radiosity values.
The lumpy-* workloads behave fairly similarly, though the lumpy-rad workload’s behaviour also bears some similarity to that of the prim-* workloads due to the addition of radiosity-related functions. These are the only workloads in which the pov::POVFPU_RunDefault function is significant, as they are the only workloads which make use of isosurfaces. As well, pov::Noise is called more often than in other workloads as the shapes are made up of noise-based functions.
Finally, the train and refrate workloads both exercise several functions that are rarely if ever called in the other workloads. Despite their extremely different runtimes the two workloads behave nearly identically, which could be problematic for assessing feedback-directed optimizations as the benchmark performs essentially the same work both during training and during the reference run.
Given the wide variety of behaviours shown in this section, it is likely that there are other parts of the benchmark’s code which are never exercised even with this new set of workloads. Creation of further workloads is recommended.
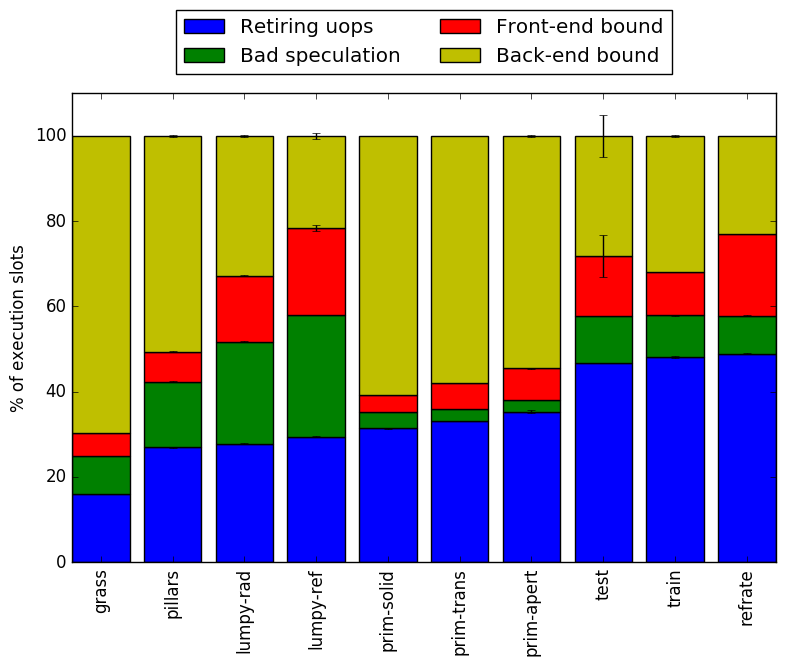
In this section, we will first use the Intel “Top-Down” methodology6to see where the processor is spending its time while running the benchmark. This methodology breaks the benchmark’s total execution slots into four high-level classifications:
The event counters used in the formulas to calculate each of these values can be inaccurate. Therefore the information should be considered with some caution. Nonetheless, they provide a broad, generally reasonable overview of the benchmark’s performance.
Figure 6 shows the distribution of execution slots spent on each of the aforementioned Top-Down categories. Depending on the workload, the ratio of work is completely different, which confirms that different workloads can exercise the processor in very different ways.
The grass workload is heavily backend-bound, which is likely due to the fact that rendering a mesh requires constantly reading triangle data from memory.
The prim-* and pillars workloads are similarly backend-bound, but with a higher retiring bound, suggesting that more time is spent doing useful work. For the pillars and prim-apert workloads, the backend bound is slightly less than the other three bounds combined.
The lump-* workloads have an even lower backend bound with a larger focus on frontend and bad speculation stalls. This may be explained by the fact that isosurfaces require more calculation than pure memory recall, so backend bound will naturally decrease as less memory access is required. The reason for the increase in front-end and bad speculation bound is less clear, though it may be due to the way that isosurface functions (which are not part of the compiled code, but instead parsed by the benchmark) are computed.
Lastly, unlike the other workloads, the train and refrate functions are mostly retiring-bound. The train workload has more variance as its runtime is significantly shorter than refrate’s, but we can see that, as expected, the two workloads have a fairly similar top-down profile.
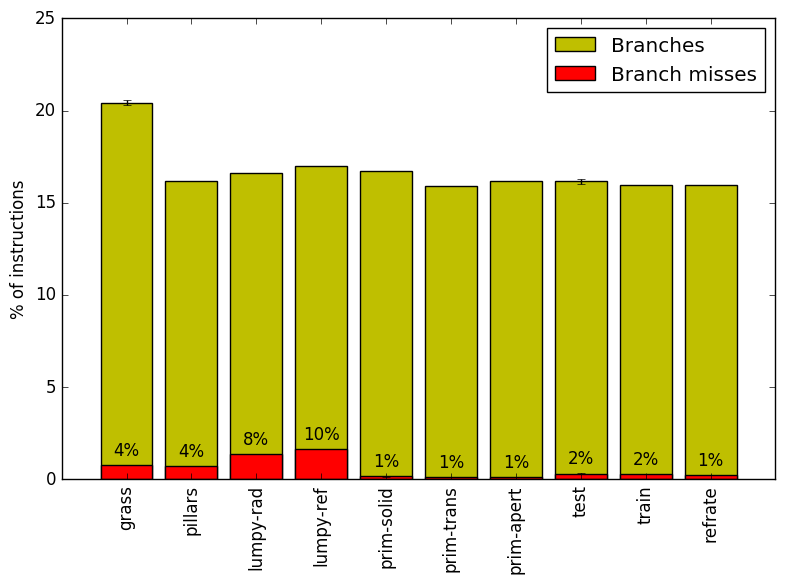
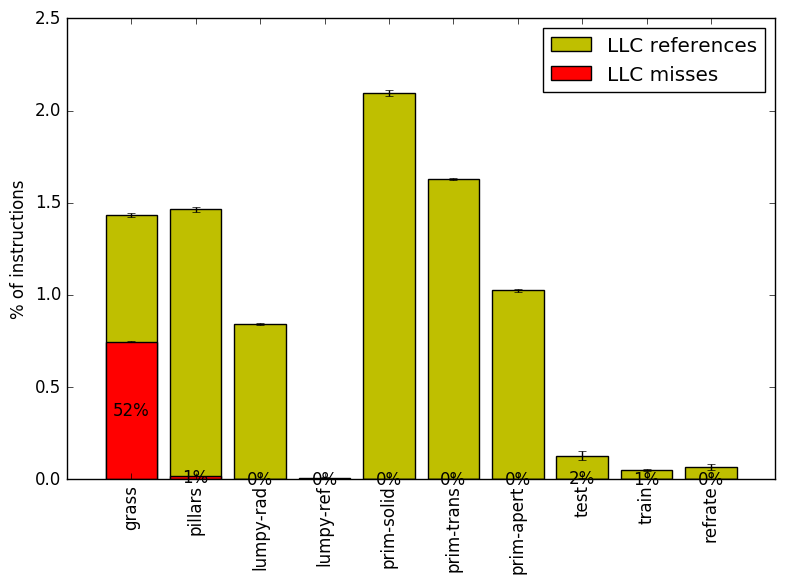
We now analyze cache and branching behaviour more closely. Figures 7 and 8 show, respectively, the rate of branching instructions and last-level cache (LLC) accesses from the same runs as Figure 6. As the benchmark executes a vastly different number of instructions for each workload, which makes comparison between benchmarks difficult, the values shown are rates per instruction executed.
Figure 7 demonstrates that, other than grass, most of the workloads have a similar rate of branching instructions. The branch miss rate for test, train and refrate is around 2%. The branch miss rate for grass and pillars is around 4%. The branch miss rate for lumpy-* workloads is around 8%. This pattern matches that seen in Figure 6 in which these workloads have higher bad speculation bounds.
Figure 8 reveals that most of the workloads rarely miss the LLC. The grass workload is the one exception, as it misses the LLC 52% of the times that it is referenced – hence its high backend bound. Meanwhile, while the pillars and prim-* workloads seldom miss the LLC, they do reference it much more frequently than the other workloads, which likely contributes to backend stall as they have missed the first two levels of cache. In contrast, the train, refrate and especially lumpy-ref workloads seem to catch most memory accesses in the first two levels of cache and so they have fairly low backend bounds.
This section compares the performance of the benchmark when compiled with either GCC (version 4.8.2); the Clang frontend to LLVM (version 3.4); or the Intel ICC compiler (version 14.0.3). To this end, the benchmark was compiled with all three compilers at six optimization levels (-O{0-3}, -Os and -Ofast), resulting in 18 different executables. Each workload was then run 3 times with each executable on the Intel Core i7-2600 machines described earlier.
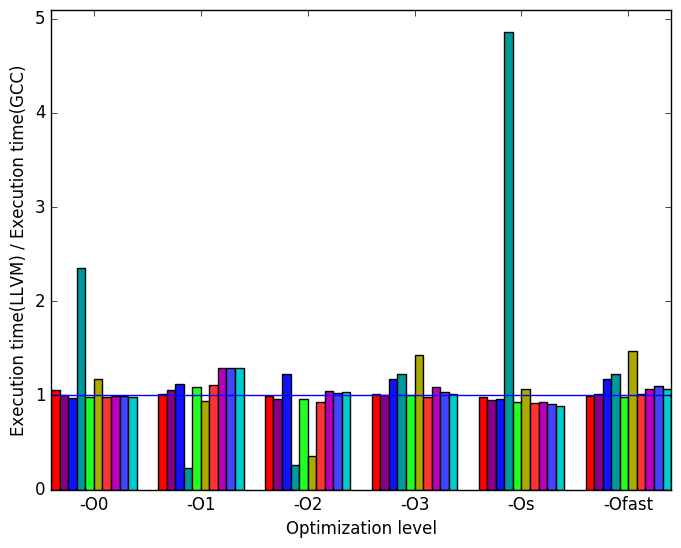
First, we compare GCC to LLVM. There are a few notable differences in their behaviour, the most prominent of which are highlighted in Figure 9.
Figure 10a shows that the execution times are generally similar. However, the lumpy-ref workload is notably slower in the LLVM version at levels -O0 and -Os, while it is around 5 times faster at levels -O1 and -O2. Similarly, though less pronounced, the prim-trans workload is slower for levels -O3 and -Ofast, but is faster at level -O2.
Figure 10b demonstrates that many of the spikes and dips seen in Figure 10a can be explained by the number of instructions executed. However, the spike in number of instructions in the workload lumpy-ref as seen in Figure 10b does not affect the execution time.
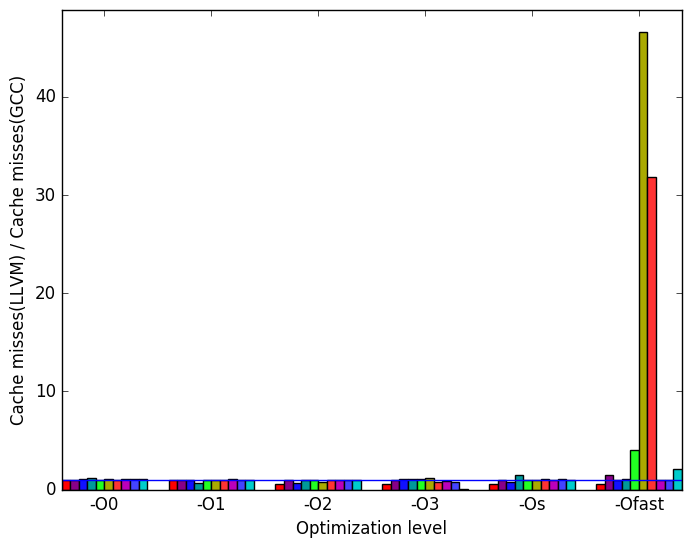
Figure 10c reveals that at levels -Ofast LLVM misses significantly more last level cache references on all prim-* inputs.
Figure 10d shows data translation lookaside buffer (dTLB( misses. The number of misses varies depending on the input.
 (a)
relative
execution
time
(a)
relative
execution
time 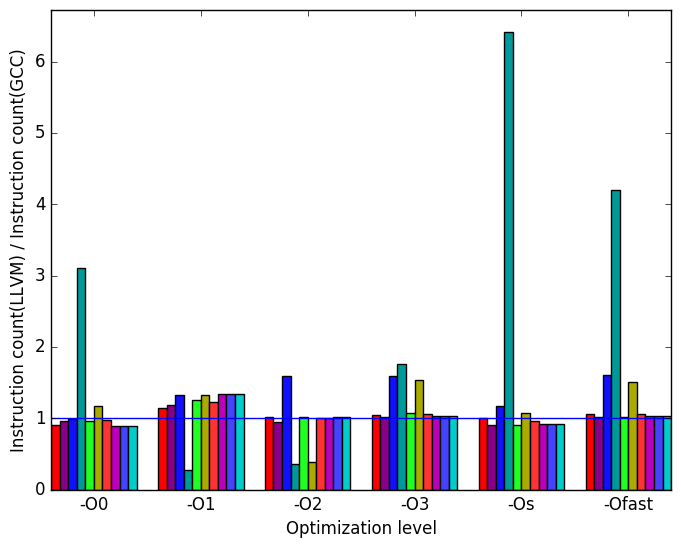 (b)
instructions
executed
(b)
instructions
executed
 (c)
cache
misses
(c)
cache
misses 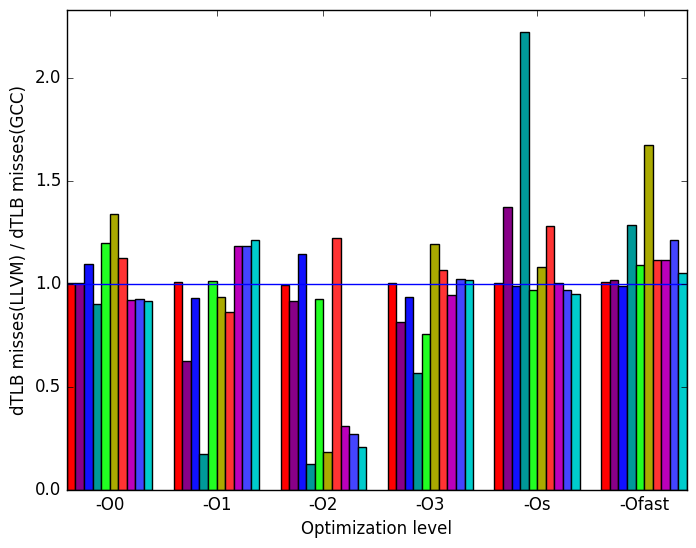 (d)
dTLB
misses
(load
and
store
combined)
(d)
dTLB
misses
(load
and
store
combined)
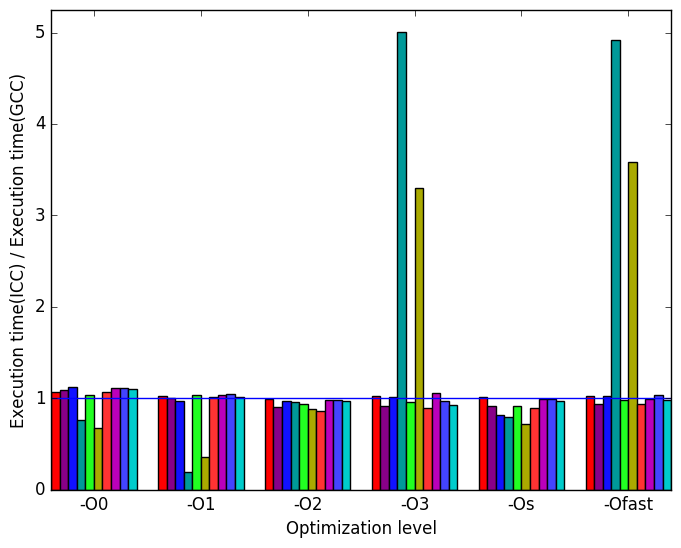
Once again, the most prominent differences between the ICC- and GCC- generated code are highlighted in Figure 11.
Figure 12a shows a similar pattern to Figure 10a, though the spikes and dips occur for different optimization levels: lumpy-ref sees slowdowns at levels -O3 and -Ofast, and a speedup for levels -O0 and -O1, while prim-trans sees slowdowns at levels -O3, -Os and -Ofast, and a speedup at level -O0.
In Figure 12b, we see once again that most of the variation in execution time is explained by the number of instructions executed for each workload.
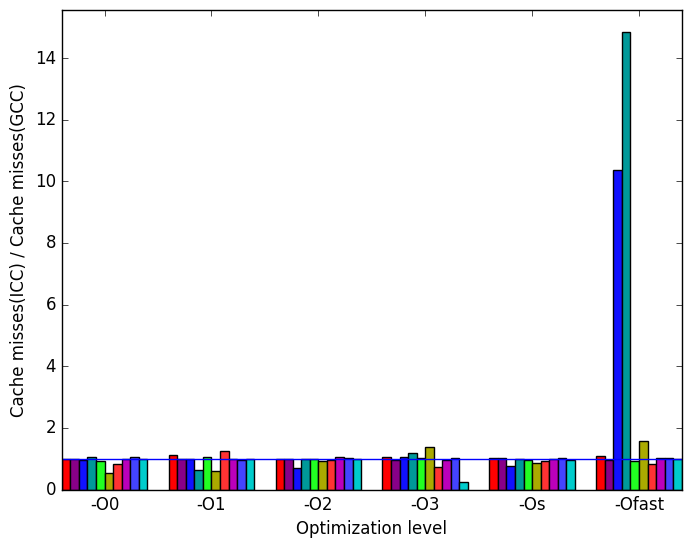
Figure 12c reveals that like LLVM, ICC also significantly reduces the number of cache misses at levels -O2 and -O3 in comparison to GCC. Thus, GCC’s cache behaviour appears to be poor for this benchmark at levels -O2 and -O3 (though as noted earlier, perhaps not as poor as it may appear).
Finally, Figure 12d data translation lookaside buffer (dTLB) misses. As with LLVM, dTLB misses are highly depended on input.
 (a)
relative
execution
time
(a)
relative
execution
time 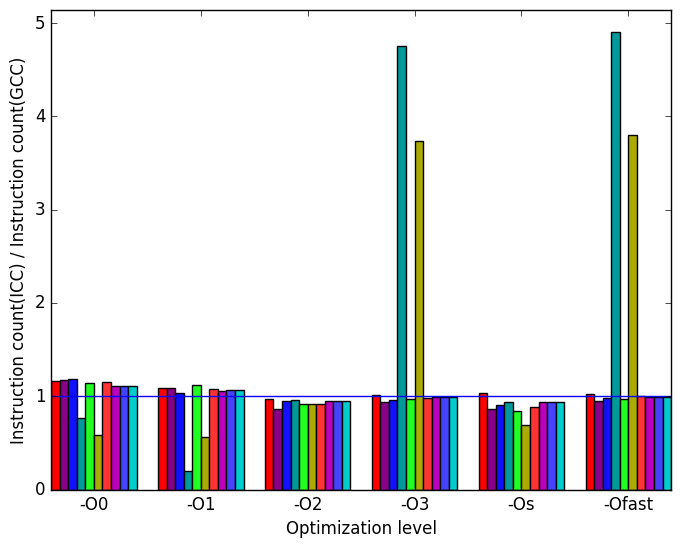 (b)
instructions
executed
(b)
instructions
executed
 (c)
cache
misses
(c)
cache
misses 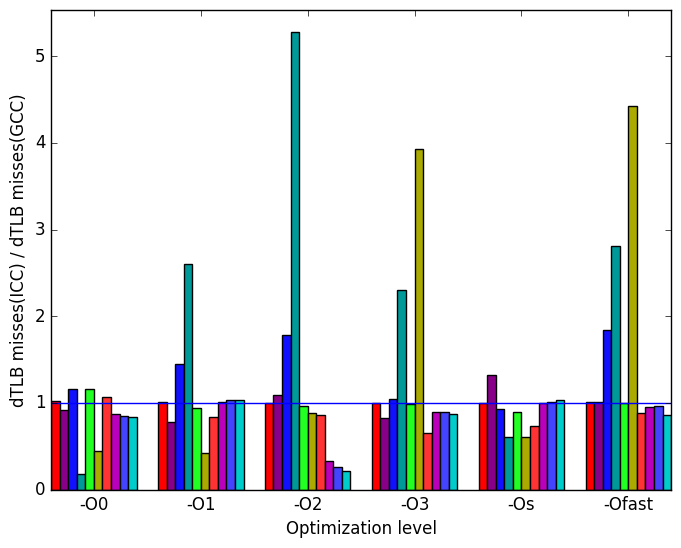 (d)
dTLB
misses
(load
and
store
combined)
(d)
dTLB
misses
(load
and
store
combined)
 (e)
Legened
for all
graphs
in
Figures 9
and
11
(e)
Legened
for all
graphs
in
Figures 9
and
11
The 511.povray_r benchmark’s behaviour varies greatly depending on its inputs, though this is not reflected by the relative sameness of the SPEC workloads. The addition of 7 new workloads revealed many portions of the code which were rarely if ever visited by train and refrate. Producing further inputs for this benchmark would be beneficial, as it would allow even more of its code to be exercised. The importance of thoroughly exploring this program’s many behaviours is underlined by Section 4.4, in which we see that the different compilers may Cau¡se very different performance – but if we were to look only at train and refrate, these differences would not be visible.
| Symbol | Time Spent (geost) |
| pov::ra_ | |
| average_near | 0.00 (1.00) |
| pov::ot_ | |
| dist_traverse | 0.00 (1.00) |
| pov::mesh_hash | 57.24 (1.00) |
| pov::compute_ | |
| lighted_texture | 0.36 (1.01) |
| pov::POVFPU_ | |
| RunDefault | 0.28 (1.03) |
| pov::Noise | 0.06 (1.02) |
| pov::Intersect_ | |
| BBox_Tree | 0.11 (1.01) |
| pov::Inside_Plane | 0.00 (1.00) |
| pov::Get_ | |
| Token [clone .part.4] | 5.30 (1.01) |
| pov::Check_ | |
| And_Enqueue | 16.20 (1.00) |
| pov::All_Sphere_ | |
| Intersections | 0.00 (1.00) |
| pov::All_Quadric_ | |
| Intersections | 0.00 (1.00) |
| pov::All_Plane_ | |
| Intersections | 0.00 (1.00) |
| pov::All_CSG_ | |
| Intersect_Intersections | 0.00 (1.00) |
| __ieee754_pow_sse2 | 0.12 (1.01) |
| Symbol | Time Spent (geost) |
| pov::ra_ | |
| average_near | 22.85 (1.00) |
| pov::ot_ | |
| dist_traverse | 37.00 (1.00) |
| pov::mesh_hash | 0.00 (1.00) |
| pov::compute_ | |
| lighted_texture | 1.44 (1.02) |
| pov::POVFPU_ | |
| RunDefault | 0.00 (1.00) |
| pov::Noise | 0.00 (1.00) |
| pov::Intersect_ | |
| BBox_Tree | 9.71 (1.00) |
| pov::Inside_Plane | 0.00 (1.00) |
| pov::Get_ | |
| Token [clone .part.4] | 0.00 (1.00) |
| pov::Check_ | |
| And_Enqueue | 0.10 (1.01) |
| pov::All_Sphere_ | |
| Intersections | 0.43 (1.01) |
| pov::All_Quadric_ | |
| Intersections | 0.00 (1.00) |
| pov::All_Plane_ | |
| Intersections | 0.39 (1.01) |
| pov::All_CSG_ | |
| Intersect_Intersections | 1.24 (1.02) |
| __ieee754_pow_sse2 | 3.05 (1.01) |
| Symbol | Time Spent (geost) |
| pov::ra_ | |
| average_near | 15.74 (1.01) |
| pov::ot_ | |
| dist_traverse | 9.86 (1.01) |
| pov::mesh_hash | 0.00 (1.00) |
| pov::compute_ | |
| lighted_texture | 0.69 (1.03) |
| pov::POVFPU_ | |
| RunDefault | 47.76 (1.01) |
| pov::Noise | 8.63 (1.01) |
| pov::Intersect_ | |
| BBox_Tree | 0.50 (1.01) |
| pov::Inside_Plane | 0.00 (1.00) |
| pov::Get_ | |
| Token [clone .part.4] | 0.00 (1.00) |
| pov::Check_ | |
| And_Enqueue | 0.07 (1.01) |
| pov::All_Sphere_ | |
| Intersections | 0.00 (1.00) |
| pov::All_Quadric_ | |
| Intersections | 0.00 (1.00) |
| pov::All_Plane_ | |
| Intersections | 0.17 (1.01) |
| pov::All_CSG_ | |
| Intersect_Intersections | 0.00 (1.00) |
| __ieee754_pow_sse2 | 0.10 (1.01) |
| Symbol | Time Spent (geost) |
| pov::ra_ | |
| average_near | 0.00 (1.00) |
| pov::ot_ | |
| dist_traverse | 0.00 (1.00) |
| pov::mesh_hash | 0.00 (1.00) |
| pov::compute_ | |
| lighted_texture | 0.63 (1.02) |
| pov::POVFPU_ | |
| RunDefault | 66.01 (1.00) |
| pov::Noise | 11.77 (1.00) |
| pov::Intersect_ | |
| BBox_Tree | 0.24 (1.01) |
| pov::Inside_Plane | 0.00 (1.00) |
| pov::Get_ | |
| Token [clone .part.4] | 0.00 (1.00) |
| pov::Check_ | |
| And_Enqueue | 0.12 (1.00) |
| pov::All_Sphere_ | |
| Intersections | 0.00 (1.00) |
| pov::All_Quadric_ | |
| Intersections | 0.00 (1.00) |
| pov::All_Plane_ | |
| Intersections | 0.14 (1.01) |
| pov::All_CSG_ | |
| Intersect_Intersections | 0.00 (1.00) |
| __ieee754_pow_sse2 | 0.44 (1.01) |
| Symbol | Time Spent (geost) |
| pov::ra_ | |
| average_near | 40.30 (1.00) |
| pov::ot_ | |
| dist_traverse | 45.35 (1.00) |
| pov::mesh_hash | 0.00 (1.00) |
| pov::compute_ | |
| lighted_texture | 1.78 (1.02) |
| pov::POVFPU_ | |
| RunDefault | 0.00 (1.00) |
| pov::Noise | 0.00 (1.00) |
| pov::Intersect_ | |
| BBox_Tree | 0.83 (1.01) |
| pov::Inside_Plane | 0.00 (1.00) |
| pov::Get_ | |
| Token [clone .part.4] | 0.00 (1.00) |
| pov::Check_ | |
| And_Enqueue | 0.35 (1.01) |
| pov::All_Sphere_ | |
| Intersections | 0.14 (1.01) |
| pov::All_Quadric_ | |
| Intersections | 0.00 (1.00) |
| pov::All_Plane_ | |
| Intersections | 0.44 (1.01) |
| pov::All_CSG_ | |
| Intersect_Intersections | 0.00 (1.00) |
| __ieee754_pow_sse2 | 0.55 (1.01) |
| Symbol | Time Spent (geost) |
| pov::ra_ | |
| average_near | 26.96 (1.01) |
| pov::ot_ | |
| dist_traverse | 35.28 (1.04) |
| pov::mesh_hash | 0.00 (1.00) |
| pov::compute_ | |
| lighted_texture | 4.61 (1.02) |
| pov::POVFPU_ | |
| RunDefault | 0.00 (1.00) |
| pov::Noise | 0.00 (1.00) |
| pov::Intersect_ | |
| BBox_Tree | 2.09 (1.03) |
| pov::Inside_Plane | 0.00 (1.00) |
| pov::Get_ | |
| Token [clone .part.4] | 0.00 (1.00) |
| pov::Check_ | |
| And_Enqueue | 1.09 (1.01) |
| pov::All_Sphere_ | |
| Intersections | 0.33 (1.01) |
| pov::All_Quadric_ | |
| Intersections | 0.00 (1.00) |
| pov::All_Plane_ | |
| Intersections | 1.16 (1.01) |
| pov::All_CSG_ | |
| Intersect_Intersections | 0.00 (1.00) |
| __ieee754_pow_sse2 | 4.47 (1.03) |
| Symbol | Time Spent (geost) |
| pov::ra_ | |
| average_near | 18.17 (1.01) |
| pov::ot_ | |
| dist_traverse | 36.64 (1.02) |
| pov::mesh_hash | 0.00 (1.00) |
| pov::compute_ | |
| lighted_texture | 5.54 (1.02) |
| pov::POVFPU_ | |
| RunDefault | 0.00 (1.00) |
| pov::Noise | 0.00 (1.00) |
| pov::Intersect_ | |
| BBox_Tree | 2.46 (1.01) |
| pov::Inside_Plane | 0.01 (1.00) |
| pov::Get_ | |
| Token [clone .part.4] | 0.00 (1.00) |
| pov::Check_ | |
| And_Enqueue | 1.30 (1.02) |
| pov::All_Sphere_ | |
| Intersections | 0.42 (1.02) |
| pov::All_Quadric_ | |
| Intersections | 0.00 (1.00) |
| pov::All_Plane_ | |
| Intersections | 1.41 (1.01) |
| pov::All_CSG_ | |
| Intersect_Intersections | 0.00 (1.00) |
| __ieee754_pow_sse2 | 5.37 (1.01) |
| Symbol | Time Spent (geost) |
| pov::ra_ | |
| average_near | 0.00 (1.00) |
| pov::ot_ | |
| dist_traverse | 0.00 (1.00) |
| pov::mesh_hash | 0.00 (1.00) |
| pov::compute_ | |
| lighted_texture | 2.20 (1.09) |
| pov::POVFPU_ | |
| RunDefault | 0.00 (1.00) |
| pov::Noise | 2.23 (1.32) |
| pov::Intersect_ | |
| BBox_Tree | 9.22 (1.11) |
| pov::Inside_Plane | 5.53 (1.07) |
| pov::Get_ | |
| Token [clone .part.4] | 0.74 (1.34) |
| pov::Check_ | |
| And_Enqueue | 1.20 (1.00) |
| pov::All_Sphere_ | |
| Intersections | 10.41 (1.12) |
| pov::All_Quadric_ | |
| Intersections | 5.75 (1.11) |
| pov::All_Plane_ | |
| Intersections | 15.56 (1.07) |
| pov::All_CSG_ | |
| Intersect_Intersections | 9.76 (1.08) |
| __ieee754_pow_sse2 | 1.36 (1.13) |
| Symbol | Time Spent (geost) |
| pov::ra_ | |
| average_near | 0.00 (1.00) |
| pov::ot_ | |
| dist_traverse | 0.00 (1.00) |
| pov::mesh_hash | 0.00 (1.00) |
| pov::compute_ | |
| lighted_texture | 2.27 (1.06) |
| pov::POVFPU_ | |
| RunDefault | 0.00 (1.00) |
| pov::Noise | 2.34 (1.06) |
| pov::Intersect_ | |
| BBox_Tree | 8.54 (1.01) |
| pov::Inside_Plane | 5.69 (1.05) |
| pov::Get_ | |
| Token [clone .part.4] | 0.11 (1.04) |
| pov::Check_ | |
| And_Enqueue | 1.18 (1.07) |
| pov::All_Sphere_ | |
| Intersections | 10.99 (1.03) |
| pov::All_Quadric_ | |
| Intersections | 5.34 (1.05) |
| pov::All_Plane_ | |
| Intersections | 16.81 (1.03) |
| pov::All_CSG_ | |
| Intersect_Intersections | 9.28 (1.02) |
| __ieee754_pow_sse2 | 1.20 (1.06) |
| Symbol | Time Spent (geost) |
| pov::ra_ | |
| average_near | 0.00 (1.00) |
| pov::ot_ | |
| dist_traverse | 0.00 (1.00) |
| pov::mesh_hash | 0.00 (1.00) |
| pov::compute_ | |
| lighted_texture | 2.37 (1.00) |
| pov::POVFPU_ | |
| RunDefault | 0.00 (1.00) |
| pov::Noise | 2.39 (1.02) |
| pov::Intersect_ | |
| BBox_Tree | 8.05 (1.02) |
| pov::Inside_Plane | 5.78 (1.03) |
| pov::Get_ | |
| Token [clone .part.4] | 0.00 (1.00) |
| pov::Check_ | |
| And_Enqueue | 1.19 (1.01) |
| pov::All_Sphere_ | |
| Intersections | 11.25 (1.01) |
| pov::All_Quadric_ | |
| Intersections | 5.44 (1.02) |
| pov::All_Plane_ | |
| Intersections | 16.66 (1.02) |
| pov::All_CSG_ | |
| Intersect_Intersections | 9.41 (1.02) |
| __ieee754_pow_sse2 | 1.24 (1.01) |
1http://lib.povray.org/searchcollection/index.php
2http://creativecommons.org/licenses/LGPL/2.1/
3http://wiki.povray.org/content/HowTo:Use_radiosity
4http://www.povray.org/documentation/view/3.6.1/106/
6More information can be found in §B.3.2 of the Intel 64 and IA-32 Architectures Optimization Reference Manual