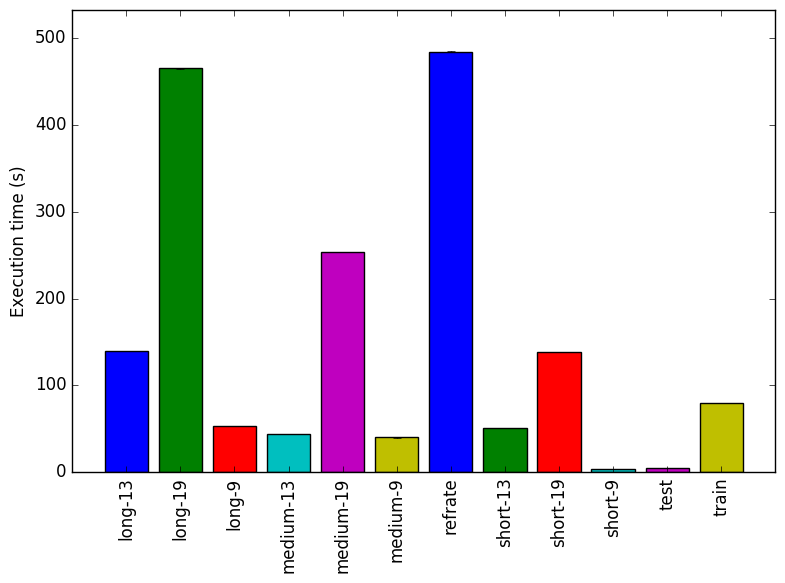
Figure 1: The mean execution time from three
runs for each workload.
This report presents:
Important take-away points from this report:
The 541.leela_r benchmark is an advanced Go playing engine featuring many of the most recent advances in computer go. It has attained ratings of 1 kyu in Internet server play.
The input for this benchmark consists of a incomplete game of go in the Smart Game Format.1
The process of generating and running workloads is, for the most part, completely automated. Place a compiled version of the 541.leela_r benchmark in the gen-input directory and call it leela_r. Following this simply cd into the gen-input directory and run make-wklds.sh.
All of the generated workloads are randomly-generated sets of go positions taken from the defunct No-Name Go Server’s archive.2
Each of the workloads generated by the system contains exactly six go positions. Moves must be culled from the end of the game to ensure that the AI plays the game to its completion. The size of the board and number of moves culled vary between inputs.
The system is configured so that all input generated will fall into one of the categories in Table 1.
| Name | Board Size | Moves Removed |
| short-9 | 9x9 | 5-15 |
| medium-9 | 9x9 | 15-30 |
| long-9 | 9x9 | 30-45 |
| short-13 | 13x13 | 10-30 |
| medium-13 | 13x13 | 40-60 |
| long-13 | 13x13 | 70-90 |
| short-19 | 19x19 | 15-40 |
| medium-19 | 19x19 | 90-120 |
| long-19 | 19x19 | 170-200 |
This section presents an analysis of the workloads created for the 541.leela_r benchmark. All data was produced using the Linux perf utility and represents the mean of three runs. In this section the following questions will be addressed:
In order to ensure a clear interpretation the analysis of the work done by the benchmark on various workloads will focus on the results obtained with GCC 4.8.4 at optimization level -O3. The execution time was measured on machines equipped with Intel Core i7-2600 processors at 3.4 GHz with 8 GiB of memory running Ubuntu 14.04 LTS on Linux Kernel 3.16.0-71.
Figure 1 shows the mean execution time of 3 runs of 541.leela_r on a certain workload. From this figure it is clear that there is an increase in execution time when the size of the board is increased. Since increasing the board size increases the number of game states this result is as would be expected.
It can also be observed that there is a relationship between the number of moves culled from the end of the game and execution time of the benchmark.
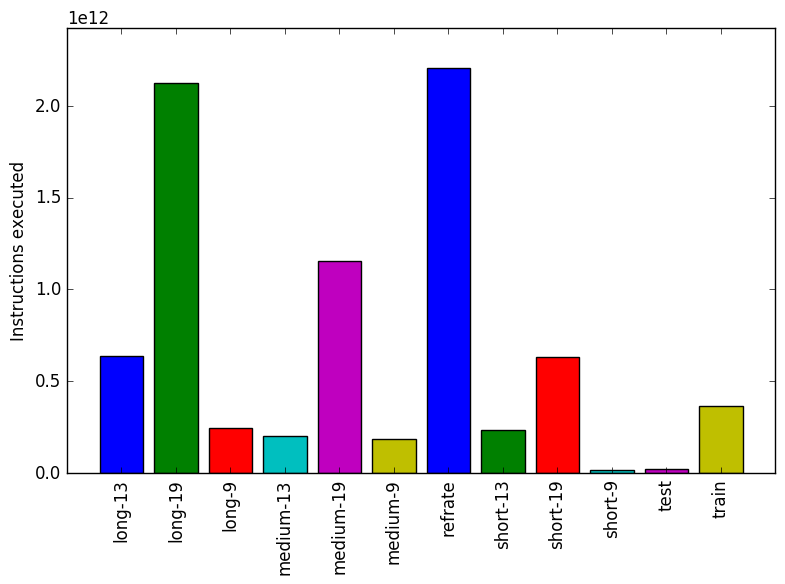
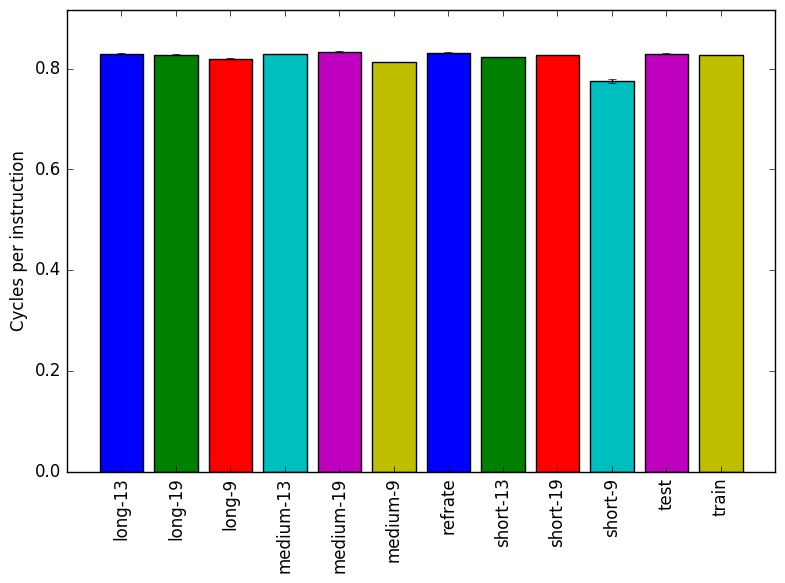
Figure 2 displays the mean instruction count and Figure 3 gives the mean clock cycles per instruction. Both means are taken from 3 runs of the corresponding workload. The most striking thing about Figure 2 is that it appears no altogether different from Figure 1. This observation is explained by Figure 3. If the CPI is relatively consistent between all workloads then the difference in execution times for the workloads should be, for the most part, explained by their instruction count. This suggests that the instruction mix is more or less independent of the input.
The analysis of the workload behavior is done using two different methodologies. The first section of the analysis is done using Intel’s top down methodology.3 The second section is done by observing changes in branch and cache behavior between workloads.
To collect data GCC 4.8.4 at optimization level -O3 is used on machines equipped with Intel Core i7-2600 processors at 3.4 GHz with 8 GiB of memory running Ubuntu 14.04 LTS on Linux Kernel 3.16.0-71. All data remains the mean of three runs.
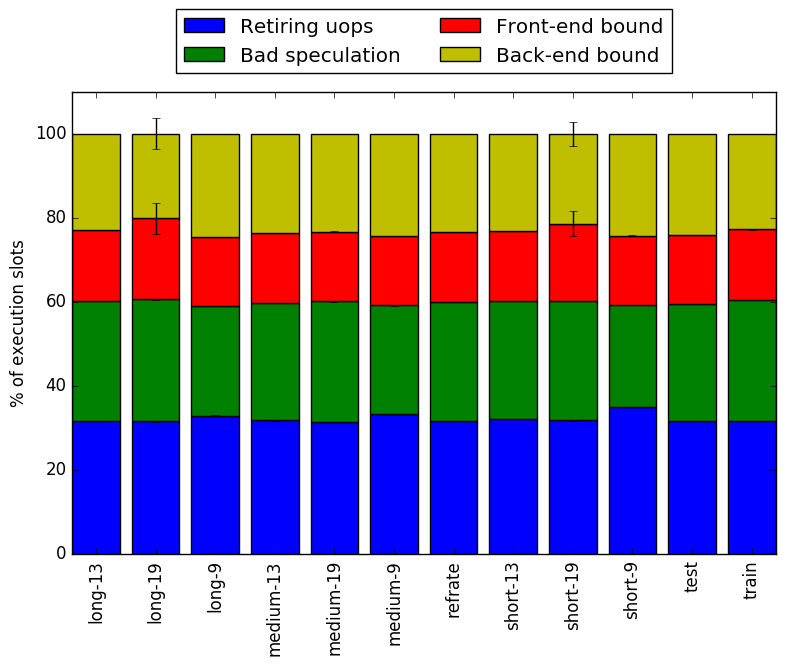
Intel’s top down methodology consists of observing the execution of micro-ops and determining where CPU cycles are spent in the pipeline. Each cycle is then placed into one of the following categories:
Using this methodology the program’s execution is broken down in Figure 4. When the various workloads are compared it is clear that there are no real differences in either the percentage of micro-ops that retire or the percentage of cycles that are spent because of bad speculation.
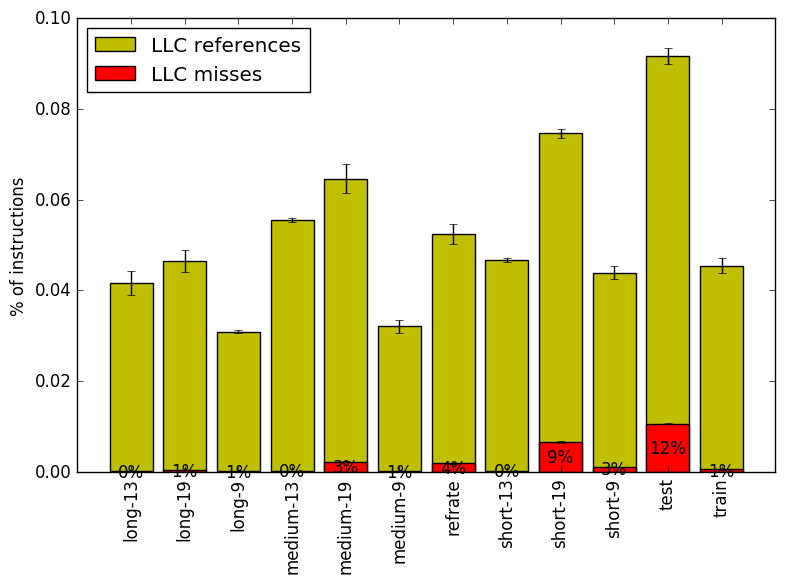
By looking at the behavior of branch predictions and cache hits and misses we can gain a deeper insight into the execution of the program between workloads.
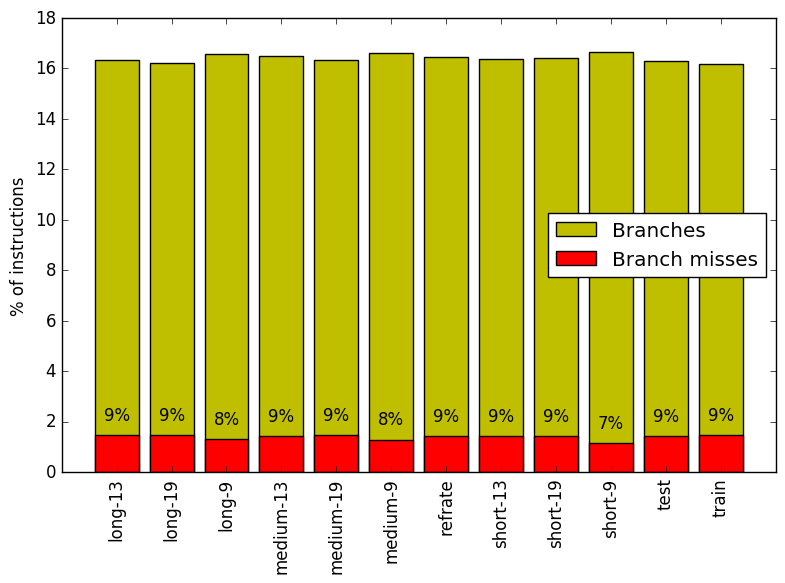
Figure 5 summarizes the percentage of instructions that are branches and exactly how many of those result in a miss. It is clear that there is minimal fluctuation between different workloads.
Figure 6 summarizes the percentage of LLC accesses and exactly how many of those result in LLC misses. Here there are two important trends. The first is that a larger board appears to increase both the number of LLC accesses and the number of overall LLC misses. The second is that increasing the number of moves removed seems to lessen the penalty of a larger board in regards to both LLC access and overall LLC misses.
Limiting the experiments to only one compiler can endanger the validity of the research. To compensate for this a comparison of results between GCC (version 4.8.4) and the Intel ICC compiler (version 16.0.3) has been conducted. Furthermore, due to the prominence of LLVM in compiler technology a comparison between results observed through only GCC (version 4.8.4) and results observed using the Clang frontend to LLVM (version 3.6) has also been conducted.
Due to the sheer number of factors that can be compared, only those that exhibit a considerable difference have been included in this section.
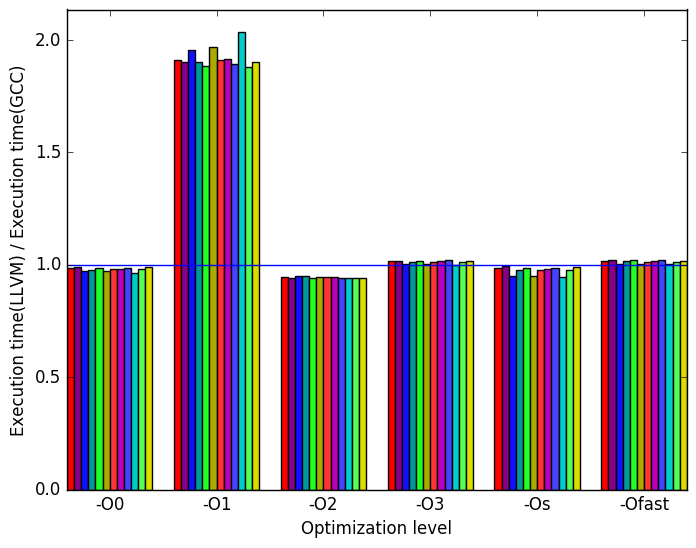
Figure 7 summarizes some interesting differences gained as the result of swapping GCC out with an LLVM based compiler. The first noteworthy characteristic of the results is that the only difference between GCC and LLVM appears to occurs at the optimization level -O1. As such the remainder of the analysis of LLVM will consider only the optimization level -O1.
At this optimization level LLVM takes approximately twice as long to execute. Furthermore there are considerably more branch instructions executed overall but with a lower miss rate. Furthermore LLVM has fewer page faults per instruction.
This information appears to indicate that LLVM is performing more work on the same data then GCC does. Though this cannot be confirmed without further experiments.
 (a)
relative
execution
time
(a)
relative
execution
time 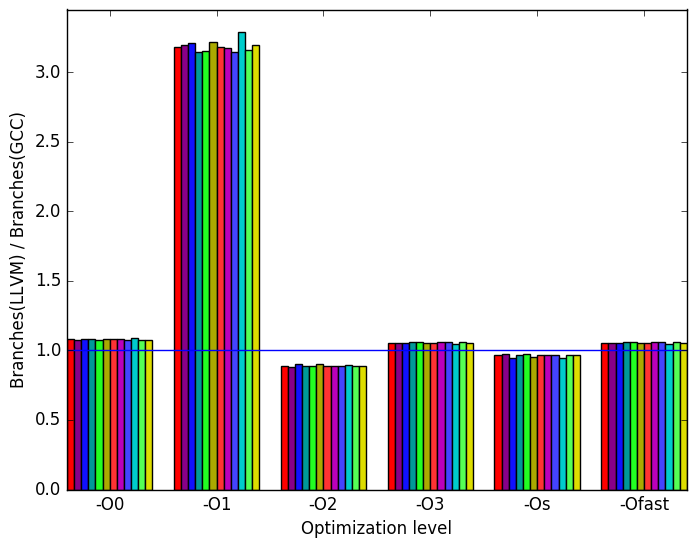 (b)
branch
instructions
(b)
branch
instructions
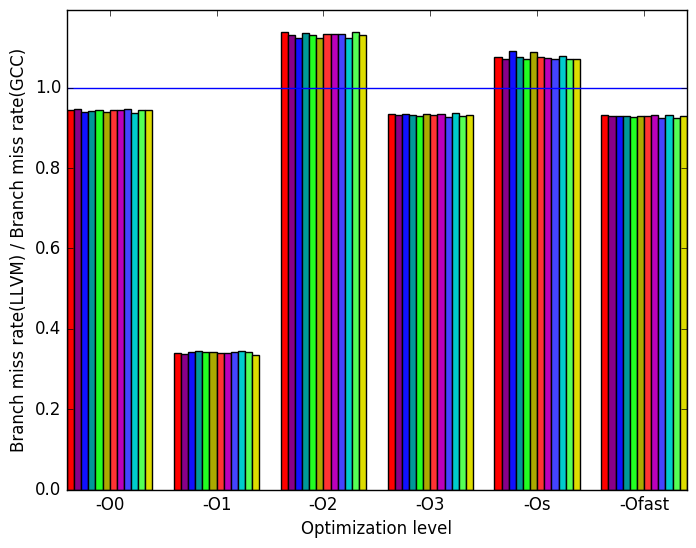 (c)
branch
miss
rate
(c)
branch
miss
rate 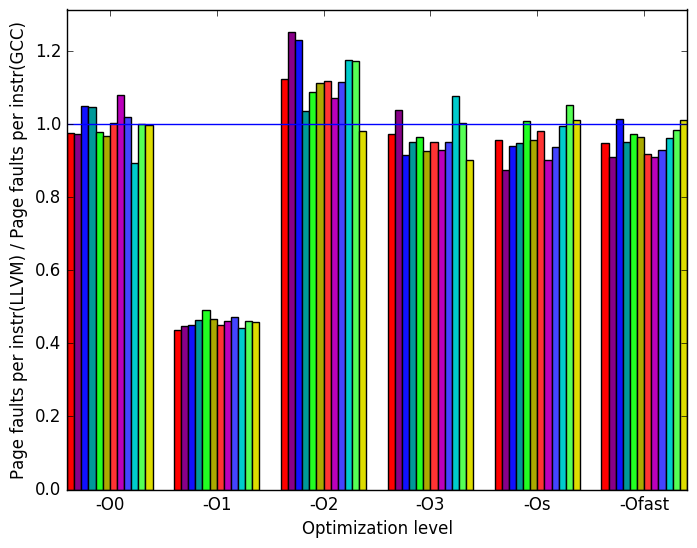 (d)
page
faults
per
instruction
(d)
page
faults
per
instruction
Figure ?? summarizes some interesting differences gained as the result of swapping GCC out with the Intel ICC compiler. It is clear that the only large difference between the two in regards to the execution of this benchmark lies in dTLB load misses and dTLB store misses when the optimization level is set to -O0.
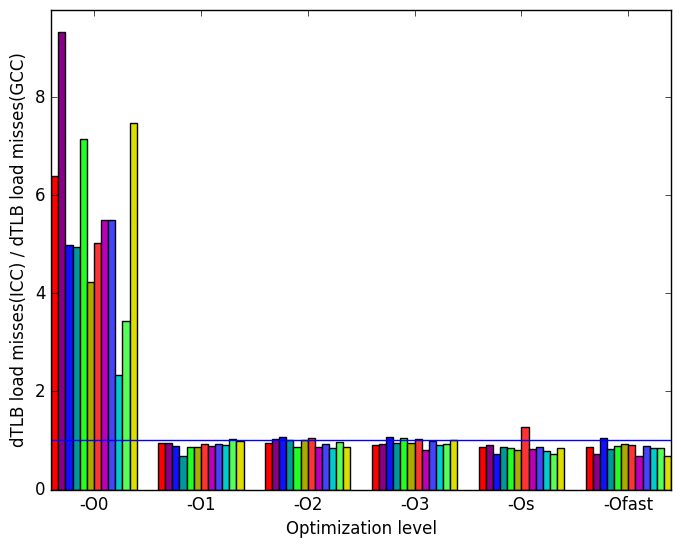 (a)
dTLB
load
misses
(a)
dTLB
load
misses 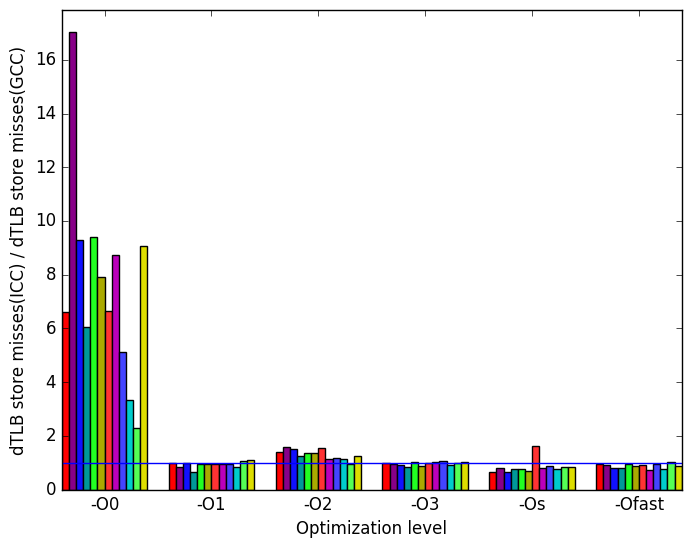 (b)
dTLB
store
misses
(b)
dTLB
store
misses
 (c)
Legend
for all
the
graph
Figures 7
(c)
Legend
for all
the
graph
Figures 7
The execution of the 541.leela_r benchmark is primarily affected by the size of the board it receives as input and is only marginally affected by the number of moves culled from the end of the game. The existing train workload is an accurate model of one case of the benchmark’s execution but does not adequately represent all viable inputs to the program. The set of new workloads presented here along with the already existing workloads provide a comprehensive exercise of the benchmark.
| Symbol | Time Spent (geost) |
| UCTNode::uct_ | |
| select_child | 4.18 (1.00) |
| FastState:: | |
| play_random_move | 12.23 (1.00) |
| FastBoard:: | |
| update_board_fast | 15.96 (1.00) |
| FastBoard:: | |
| self_atari | 6.65 (1.00) |
| FastBoard::save_ | |
| critical_neighbours | 6.65 (1.00) |
| FastBoard:: | |
| no_eye_fill | 5.36 (1.00) |
| FastBoard::nbr_ | |
| criticality | 4.99 (1.01) |
| FastBoard::get_ | |
| pattern_fast_augment | 5.62 (1.00) |
| FastBoard::add_ | |
| pattern_moves | 11.94 (1.00) |
| Symbol | Time Spent (geost) |
| UCTNode::uct_ | |
| select_child | 3.17 (1.00) |
| FastState:: | |
| play_random_move | 13.12 (1.00) |
| FastBoard:: | |
| update_board_fast | 16.78 (1.00) |
| FastBoard:: | |
| self_atari | 6.16 (1.01) |
| FastBoard::save_ | |
| critical_neighbours | 6.92 (1.00) |
| FastBoard:: | |
| no_eye_fill | 4.80 (1.00) |
| FastBoard::nbr_ | |
| criticality | 5.84 (1.01) |
| FastBoard::get_ | |
| pattern_fast_augment | 6.09 (1.01) |
| FastBoard::add_ | |
| pattern_moves | 12.46 (1.00) |
| Symbol | Time Spent (geost) |
| UCTNode::uct_ | |
| select_child | 8.53 (1.00) |
| FastState:: | |
| play_random_move | 9.96 (1.01) |
| FastBoard:: | |
| update_board_fast | 13.39 (1.01) |
| FastBoard:: | |
| self_atari | 7.10 (1.01) |
| FastBoard::save_ | |
| critical_neighbours | 6.24 (1.00) |
| FastBoard:: | |
| no_eye_fill | 4.38 (1.01) |
| FastBoard::nbr_ | |
| criticality | 3.38 (1.01) |
| FastBoard::get_ | |
| pattern_fast_augment | 4.86 (1.01) |
| FastBoard::add_ | |
| pattern_moves | 10.40 (1.01) |
| Symbol | Time Spent (geost) |
| UCTNode::uct_ | |
| select_child | 4.54 (1.01) |
| FastState:: | |
| play_random_move | 11.02 (1.02) |
| FastBoard:: | |
| update_board_fast | 15.86 (1.00) |
| FastBoard:: | |
| self_atari | 7.00 (1.02) |
| FastBoard::save_ | |
| critical_neighbours | 6.61 (1.01) |
| FastBoard:: | |
| no_eye_fill | 5.57 (1.02) |
| FastBoard::nbr_ | |
| criticality | 3.93 (1.01) |
| FastBoard::get_ | |
| pattern_fast_augment | 5.30 (1.01) |
| FastBoard::add_ | |
| pattern_moves | 11.18 (1.01) |
| Symbol | Time Spent (geost) |
| UCTNode::uct_ | |
| select_child | 3.48 (1.01) |
| FastState:: | |
| play_random_move | 12.28 (1.01) |
| FastBoard:: | |
| update_board_fast | 17.01 (1.00) |
| FastBoard:: | |
| self_atari | 6.46 (1.00) |
| FastBoard::save_ | |
| critical_neighbours | 6.72 (1.00) |
| FastBoard:: | |
| no_eye_fill | 5.10 (1.00) |
| FastBoard::nbr_ | |
| criticality | 4.87 (1.01) |
| FastBoard::get_ | |
| pattern_fast_augment | 5.75 (1.00) |
| FastBoard::add_ | |
| pattern_moves | 11.78 (1.01) |
| Symbol | Time Spent (geost) |
| UCTNode::uct_ | |
| select_child | 8.24 (1.01) |
| FastState:: | |
| play_random_move | 9.93 (1.02) |
| FastBoard:: | |
| update_board_fast | 13.49 (1.01) |
| FastBoard:: | |
| self_atari | 6.79 (1.01) |
| FastBoard::save_ | |
| critical_neighbours | 6.06 (1.01) |
| FastBoard:: | |
| no_eye_fill | 4.59 (1.00) |
| FastBoard::nbr_ | |
| criticality | 3.47 (1.01) |
| FastBoard::get_ | |
| pattern_fast_augment | 4.88 (1.01) |
| FastBoard::add_ | |
| pattern_moves | 10.38 (1.01) |
| Symbol | Time Spent (geost) |
| UCTNode::uct_ | |
| select_child | 4.52 (1.01) |
| FastState:: | |
| play_random_move | 11.61 (1.02) |
| FastBoard:: | |
| update_board_fast | 15.97 (1.00) |
| FastBoard:: | |
| self_atari | 6.77 (1.01) |
| FastBoard::save_ | |
| critical_neighbours | 6.72 (1.00) |
| FastBoard:: | |
| no_eye_fill | 5.10 (1.00) |
| FastBoard::nbr_ | |
| criticality | 4.62 (1.01) |
| FastBoard::get_ | |
| pattern_fast_augment | 5.46 (1.01) |
| FastBoard::add_ | |
| pattern_moves | 11.46 (1.00) |
| Symbol | Time Spent (geost) |
| UCTNode::uct_ | |
| select_child | 4.48 (1.01) |
| FastState:: | |
| play_random_move | 11.64 (1.02) |
| FastBoard:: | |
| update_board_fast | 15.93 (1.00) |
| FastBoard:: | |
| self_atari | 6.46 (1.01) |
| FastBoard::save_ | |
| critical_neighbours | 6.46 (1.01) |
| FastBoard:: | |
| no_eye_fill | 5.59 (1.01) |
| FastBoard::nbr_ | |
| criticality | 4.53 (1.00) |
| FastBoard::get_ | |
| pattern_fast_augment | 5.57 (1.01) |
| FastBoard::add_ | |
| pattern_moves | 11.57 (1.00) |
| Symbol | Time Spent (geost) |
| UCTNode::uct_ | |
| select_child | 3.68 (1.01) |
| FastState:: | |
| play_random_move | 11.78 (1.02) |
| FastBoard:: | |
| update_board_fast | 16.48 (1.00) |
| FastBoard:: | |
| self_atari | 6.22 (1.01) |
| FastBoard::save_ | |
| critical_neighbours | 6.51 (1.00) |
| FastBoard:: | |
| no_eye_fill | 6.07 (1.01) |
| FastBoard::nbr_ | |
| criticality | 4.49 (1.01) |
| FastBoard::get_ | |
| pattern_fast_augment | 5.58 (1.00) |
| FastBoard::add_ | |
| pattern_moves | 11.25 (1.00) |
| Symbol | Time Spent (geost) |
| UCTNode::uct_ | |
| select_child | 7.47 (1.05) |
| FastState:: | |
| play_random_move | 8.37 (1.02) |
| FastBoard:: | |
| update_board_fast | 12.05 (1.03) |
| FastBoard:: | |
| self_atari | 6.07 (1.04) |
| FastBoard::save_ | |
| critical_neighbours | 4.81 (1.03) |
| FastBoard:: | |
| no_eye_fill | 6.03 (1.06) |
| FastBoard::nbr_ | |
| criticality | 2.30 (1.07) |
| FastBoard::get_ | |
| pattern_fast_augment | 4.39 (1.04) |
| FastBoard::add_ | |
| pattern_moves | 8.57 (1.02) |
| Symbol | Time Spent (geost) |
| UCTNode::uct_ | |
| select_child | 3.49 (1.03) |
| FastState:: | |
| play_random_move | 10.82 (1.02) |
| FastBoard:: | |
| update_board_fast | 16.14 (1.02) |
| FastBoard:: | |
| self_atari | 6.18 (1.03) |
| FastBoard::save_ | |
| critical_neighbours | 6.49 (1.02) |
| FastBoard:: | |
| no_eye_fill | 5.28 (1.02) |
| FastBoard::nbr_ | |
| criticality | 3.75 (1.04) |
| FastBoard::get_ | |
| pattern_fast_augment | 5.04 (1.02) |
| FastBoard::add_ | |
| pattern_moves | 10.96 (1.02) |
| Symbol | Time Spent (geost) |
| UCTNode::uct_ | |
| select_child | 3.33 (1.01) |
| FastState:: | |
| play_random_move | 13.13 (1.01) |
| FastBoard:: | |
| update_board_fast | 16.74 (1.01) |
| FastBoard:: | |
| self_atari | 6.11 (1.01) |
| FastBoard::save_ | |
| critical_neighbours | 6.83 (1.01) |
| FastBoard:: | |
| no_eye_fill | 4.58 (1.01) |
| FastBoard::nbr_ | |
| criticality | 5.54 (1.01) |
| FastBoard::get_ | |
| pattern_fast_augment | 6.07 (1.01) |
| FastBoard::add_ | |
| pattern_moves | 12.44 (1.00) |
2https://github.com/zenon/NNGS_SGF_Archive
3More information can be found in §B.3.2 of the Intel 64 and IA-32 Architectures Optimization Reference Manual .