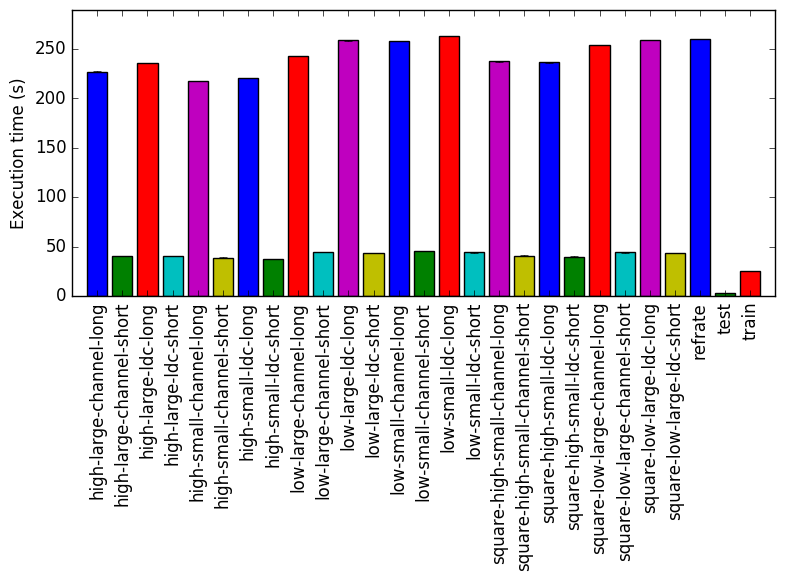
Figure 1: The mean execution time from three
runs for each workload.
This report presents:
Important take-away points from this report:
The 519.lbm_r benchmark simulates incompressible fluids in 3D using the Lattice Boltzmann Method. It serves to emulate the most computationally important part of a larger program, used in material science to simulate the behavior of fluids with free surfaces in the formation and movement of gas bubbles in metal foams. In the interest of benchmarking and to enhance portability there is extensive use of macros in the program to hide the details of data access.
The input to this benchmark consists of an obstacle file along with a number of other command line arguments. The obstacle file is an ASCII representation of the objects that occupy the channel the fluids flow through. The command line arguments are as follows:
The workloads for this benchmark are pre-generated to exercise all features of the benchmark.
A number of different workloads were generated based on possible inputs that the benchmark can receive. Each workload has the following properties associated with it:
The workloads are named according to the properties listed in the table above. The ordering of the table is the order that the properties appear in the name of each workload. Note that workloads beginning with ”square” use cubic objects instead of spherical objects.
This section presents an analysis of the workloads created for the 519.lbm_r benchmark. All data was produced using the Linux perf utility and represents the mean of three runs. In this section the following questions will be addressed:
In order to ensure a clear interpretation the analysis of the work done by the benchmark on various workloads will focus on the results obtained with GCC 4.8.2 at optimization level -O3. The execution time was measured on machines equipped with Intel Core i7-2600 processors at 3.4 GHz with 8 GiB of memory running Ubuntu 14.04.1 LTS on Linux Kernel 3.16.0-71-generic.
Figure 1 shows the mean execution time of 3 runs of 519.lbm_r on each workload. It is clear that the only thing that alters the execution time of 519.lbm_r significantly is the value of time step. Furthermore train is similar to workloads with a small value for time step and refrate is similar to workloads with a large value for time step.
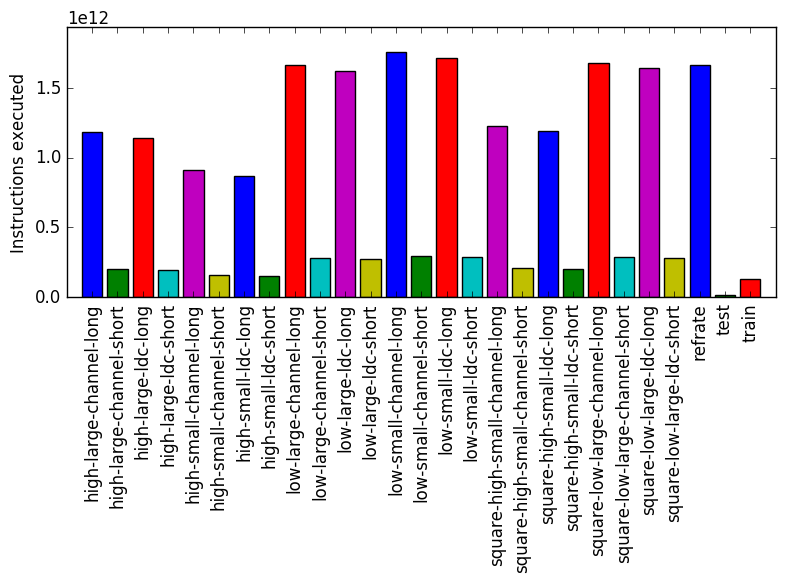
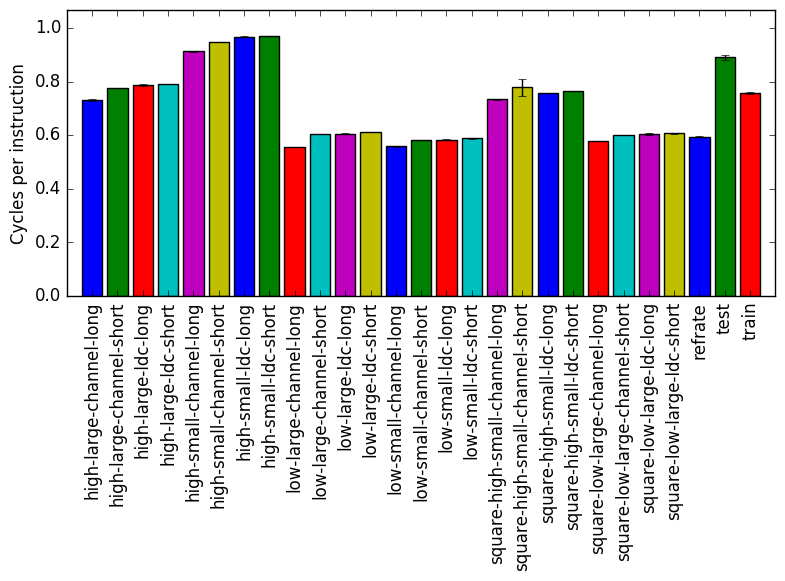
Figure 2 displays the mean instruction count and Figure 3 gives the mean clock cycles per instruction. Both means are taken from 3 runs of the corresponding workload. Despite the similar execution times, Figure 2 shows a difference in the number of instructions executed between workloads that does not seem to be explained by the value of time step. Figure 3 further emphasizes this difference. An important takeaway point from both figures is that train and refrate are not drastically different to any perceivable norm in the instruction count or cpi of workloads.
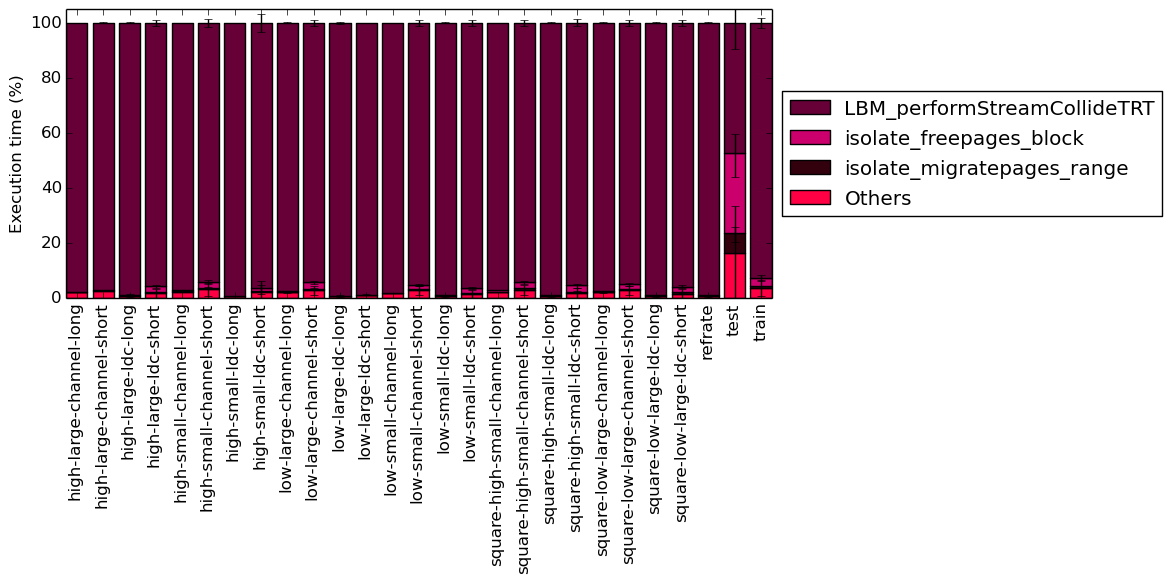
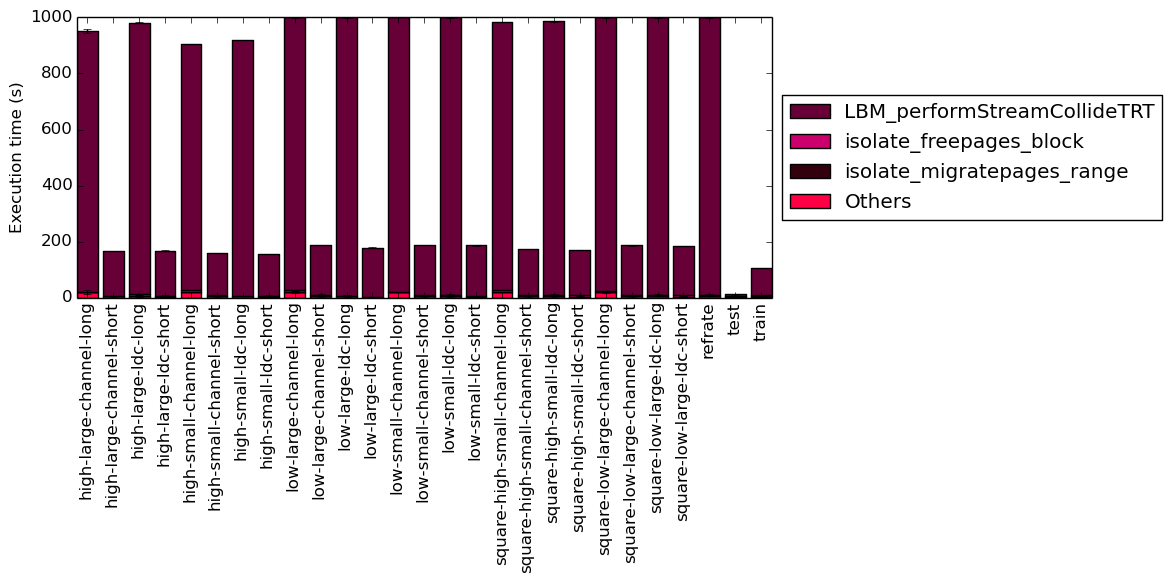
This section will analyze which parts of the benchmark are exercised by each of the workloads. To this end, we determined the percentage of execution time the benchmark spends on several of the most time-consuming functions. This data was recorded on a machine equipped with Intel Core i7-2600 processor at 3.4 GHz with 8 GiB of memory running Ubuntu 14.04.1 LTS on Linux Kernel 3.16.0-71-generic.
It is clear from both Figure 5a and Figure 5b that, with all workloads, the majority of the execution time for the program is spend on the LBM_performStreamCollideTRT function.
 (a)
Percentage
of
execution
(a)
Percentage
of
execution
 (b)
Execution
time
(b)
Execution
time
The analysis of the workload behavior is done using two different methodologies. The first section of the analysis is done using Intel’s top down methodology.1 The second section is done by observing changes in branch and cache behavior between workloads.
To collect data GCC 4.8.2 at optimization level -O3 is used on machines equipped with Intel Core i7-2600 processors at 3.4 GHz with 8 GiB of memory running Ubuntu 14.04.1 LTS on Linux Kernel 3.16.0-71-generic. All data remains the mean of three runs.
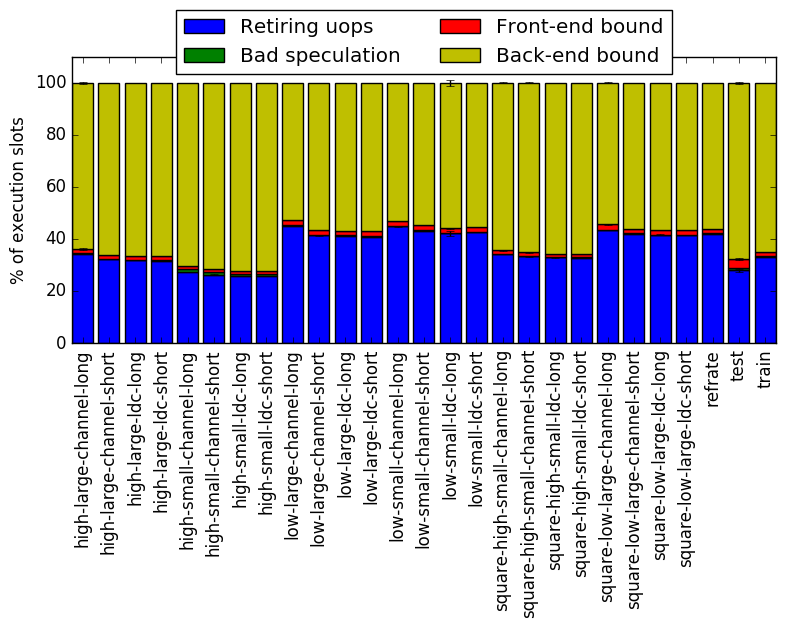
Intel’s top down methodology consists of observing the execution of micro-ops and determining where CPU cycles are spent in the pipeline. Each cycle is then placed into one of the following categories:
Using this methodology the program’s execution is broken down in Figure 6. While the top down analysis does appear to imply that there is some trend that the object density causes some change in execution it remains small.
By looking at the behavior of branch predictions and cache hits and misses we can gain a deeper insight into the execution of the program between workloads.
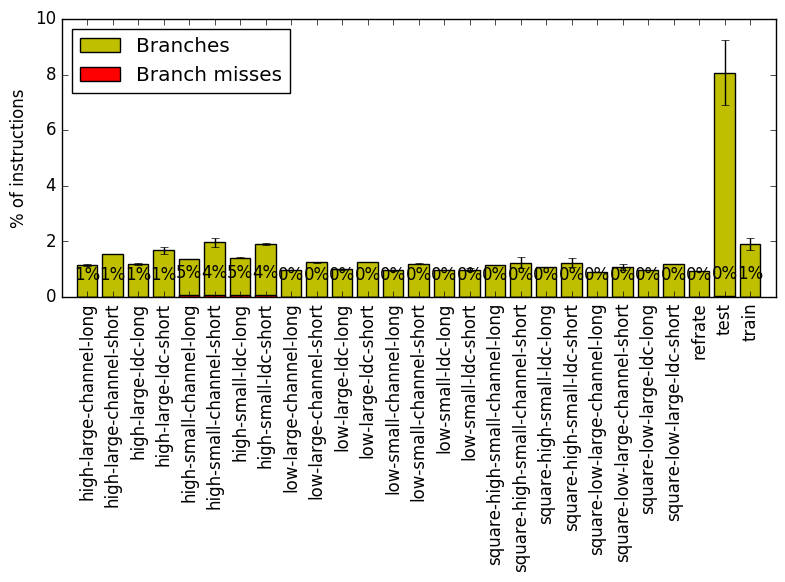
Figure 7 summarizes the percentage of instructions that are branches and exactly how many of those branches resulted in a miss. There does appear to be some small trend in the number of branches based on the workload. This remains a small trend.
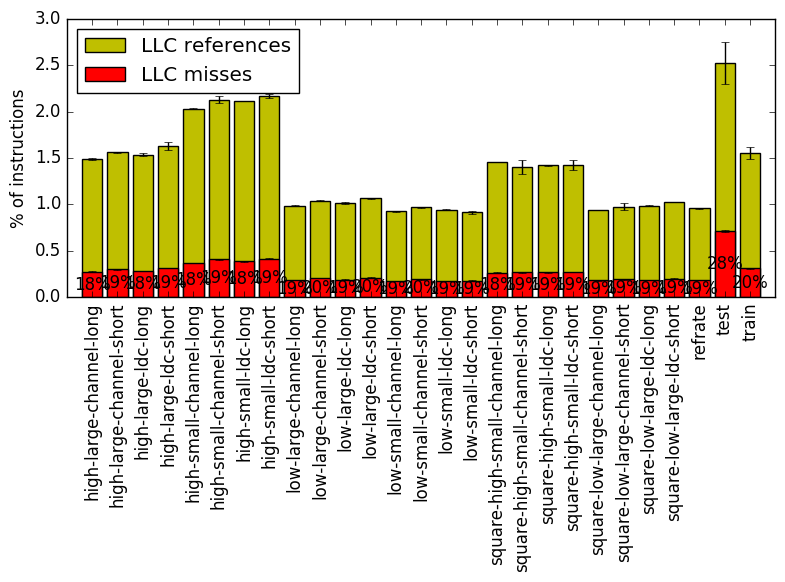
Figure 8 summarizes the percentage of LLC accesses and exactly how many of those accesses resulted in LLC misses. Here there does appear to be a considerably large trend in the number of LLC accesses and LLC misses depending on the shape, density, and size of the objects.
Note that the train and refrate workload do not appear to violate any perceivable norm that could exist in the aforementioned figures.
Limiting the experiments to only one compiler can endanger the validity of the research. To compensate for this a comparison of results between GCC (version 4.8.2) and the Intel ICC compiler (version 16.0.3) has been conducted. Furthermore, due to the prominence of LLVM in compiler technology a comparison between results observed through only GCC (version 4.8.2) and results observed using the Clang frontend to LLVM (version 3.6.2) has also been conducted.
Due to the sheer number of factors that can be compared, only those that exhibit a considerable difference have been included in this section.
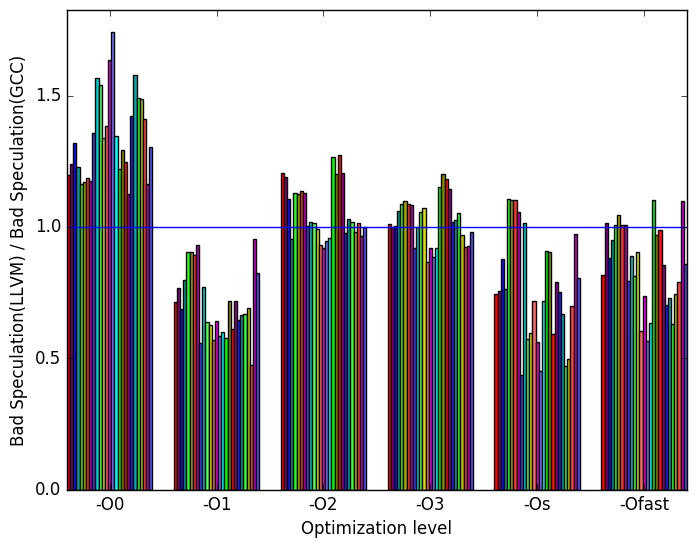
Figure 9 summarizes some interesting differences gained as the result of swapping GCC out with an LLVM based compiler. The most prominent difference that exist when compiled with llvm and with gcc is the amount of front end bound execution slots and the amount of bad speculation execution slots.
Figure 10a shows that, at optimization level -O0, llvm has considerably more bad speculation execution slots than gcc.
Figure 10b shows that, at all optimization levels save -O0 and -O3, llvm has considerably more front end bound execution slots than gcc.
 (a)
Bad
Speculation
(a)
Bad
Speculation 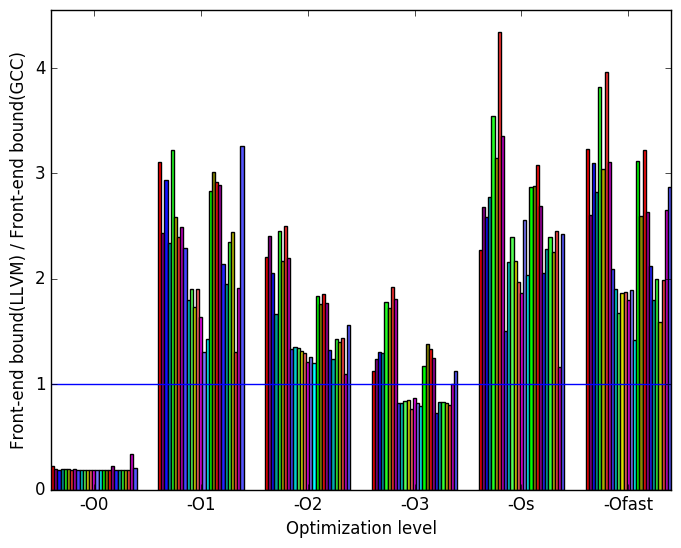 (b)
Front-end
Bound
(b)
Front-end
Bound
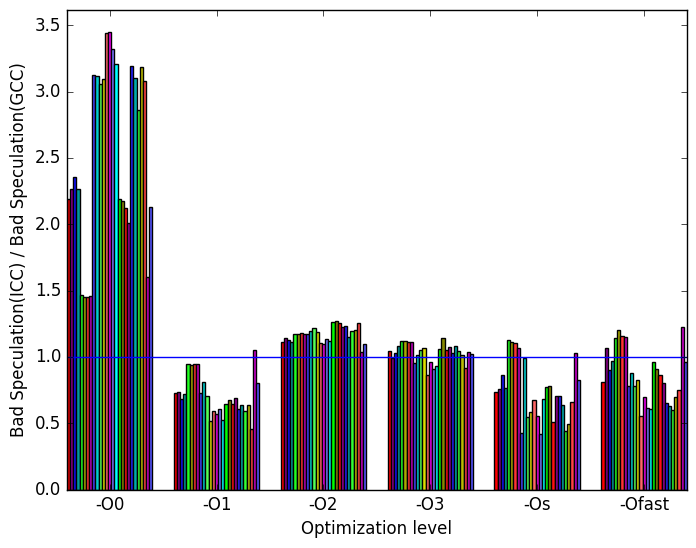
Figure 11 summarizes some interesting differences gained as the result of swapping GCC out with the Intel ICC compiler. The most prominent difference that exist when compiled with icc and with gcc appear to be in the amount of front end bound execution slots and the amount of bad speculation execution slots.
Figure 12a shows that, at optimization level -O0, icc has considerably more bad speculation execution slots than gcc.
Figure 12b shows that, at all optimization levels save -O0 and -O3, icc has considerably more front end bound execution slots than gcc.
 (a)
Bad
Speculation
(a)
Bad
Speculation 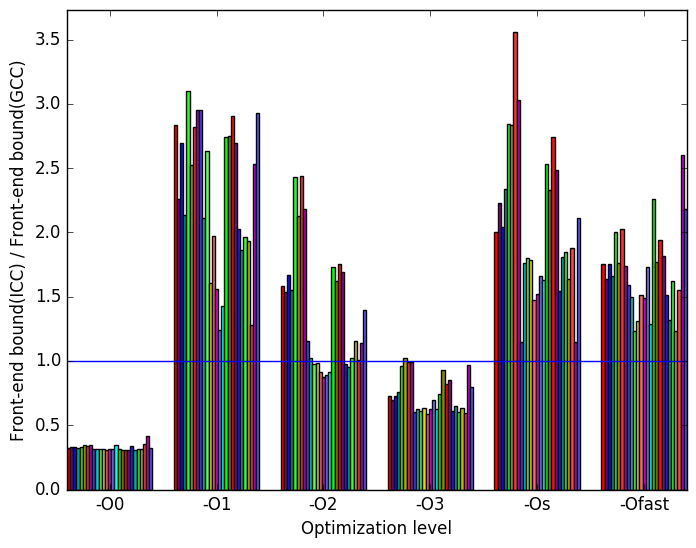 (b)
Front-end
Bound
(b)
Front-end
Bound
 (c)
Legend
for all
the
graphs
in
Figures 9
and
11
(c)
Legend
for all
the
graphs
in
Figures 9
and
11
Apart from execution time, the behaviour of 519.lbm_r does not differ significantly between workloads. The execution time of 519.lbm_r is almost entirely explained by the number of time steps is is asked to simulate.
The additional workloads that were created serve to provide a larger data set. These data sets are used as input. The train and refrate workloads behave similarly to any perceivable norm that could exist between workloads.
The only shapes that were used in the input were cubes and spheres. It is unknown if more unusual shapes would induce a different behavior for the benchmark.
1More information can be found in §B.3.2 of the Intel 64 and IA-32 Architectures Optimization Reference Manual .