Other Hinge Functions

RoBiC find a subset of genes and a subset of patients that have similar patterns within the given n × p (gene * patient) matrix M.
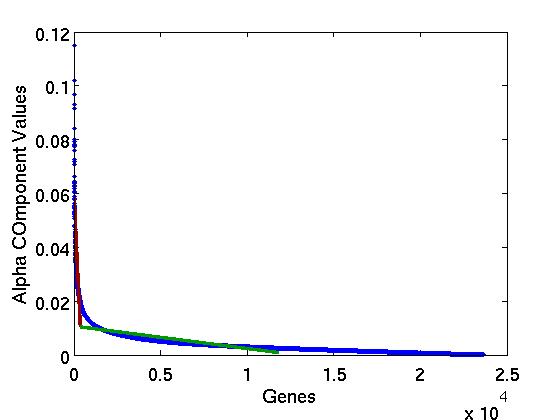
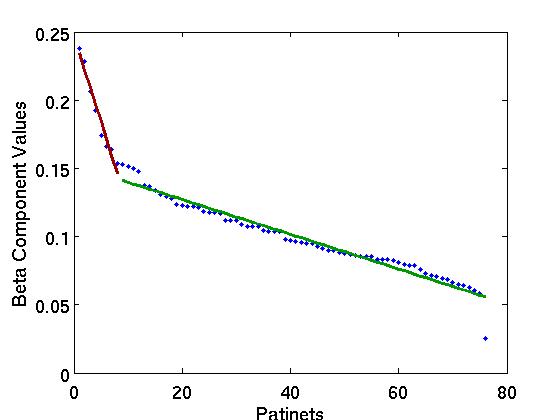
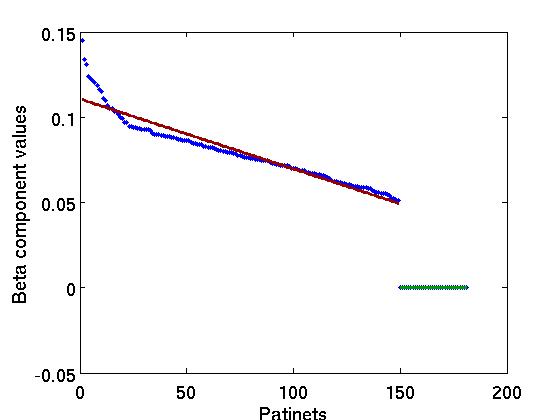
It first finds two vectors, α and β of size |α| = n and |β| = p, such that α S.βT is the best  rank-one approximation of M . (Here, α represents the gene's vector and β represents the patient's vector.)   It then sorts the values of α (resp., β), producing α(s) and β(s).  See the top row of Figure 1 below.

Finally, RoBiC identifies the bicluster with the best prefixes, based on some "hinge" function", that separates genes {g1, ..., gk} from the remaining {gk+1, ..., gn}, and separates patients {s1, ..., sm} from {sm+1, ..., sp}.   The challenge is finding the appropriate hinge.

The current RoBiC hinge function finds the best-fitting pair of lines:

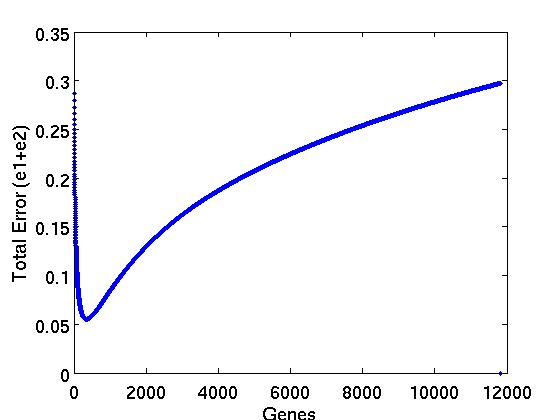
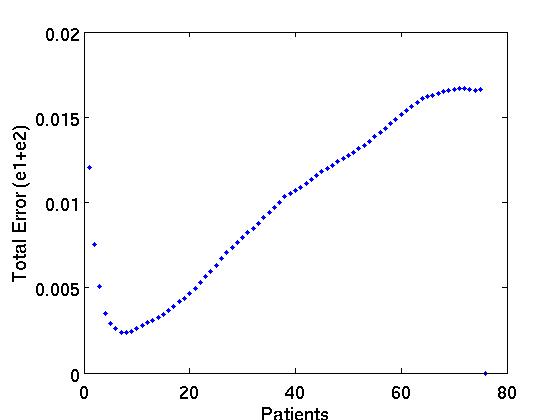
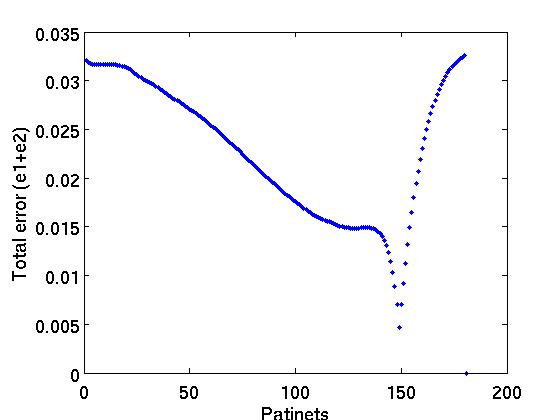
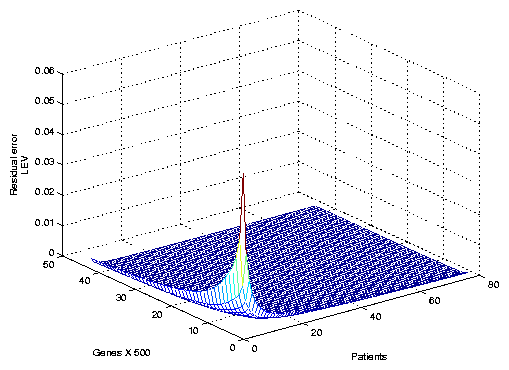
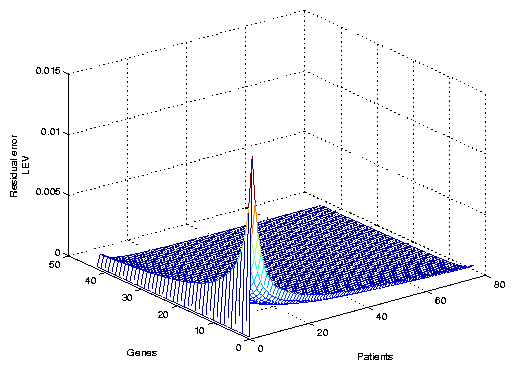
See bottom row of Figure 0.

Figure 0: [Top] Sorted α(s) (resp., β(s), β(s)) values corresponds to genes (resp., patients, patients), with "best-fit two lines" superimposed.
[Bottom]~Error values, for each position. All figures are from the first bicluster; left 2 columns are from the Breast Cancer P1 dataset, while the far right is from Lung Cancer D3.

This page considers a number of variants of this basic hinge function.
Table (1) provides prediction accuracy for different models on Breast Cancer data.
We considered three classes of hinge functions: the two models in Class A are based on partial matrices, the two models in Class B are based on simple statistical measures, and the 5 models in Class 3 all use the component values of the actual eigenvectors:
In all models, we sort the matrix, M, according to the values in α(s) and β(s) vectors.


In the next two sets of models, instead of looking at the partial matrices, we examined the components of the vectors to find the bi-clusters. These approaches are similar to the algorithm in the paper, with different hinge functions for finding the bi-clusters.
We can describe the hinge functions in Models C1-C5 using the function:
Note that the RoBiC system uses Hinge(1, 2, -, false, false). Here is the description of other models:

Table (1) shows the prediction accuracy for each model on the breast cancer data, using a SVM classifier,based on 5-fold cross-validation.  Model A1 and A2 are not presented in this table, because we could not find the separation point for patients and genes. While model C3b actually does best for this particular dataset, it was not the best for the others.
Model       Hinge Parameters
Breast Cancer
B1
69.74%
B2

53.94%
C1 Hinge(1, 2, +, false, false) 75.00%
C2 a
Hinge(1, 1, -, false, false) 86.84%
C2 b
Hinge(1, 1, +, false, false) 86.84%
C3 a Hinge(1, 1, -, true, false) 67.11%
C3 b Hinge(1, 1, +, true, false) 96.05%
C3 c Hinge(1, 2, -, true, false) 69.73%
C3 d Hinge(1, 2, +, true, false) 69.73%
C4 a Hinge(1, 2, -, false, true) 77.63%
C4 b Hinge(1, 2, +, false, true) 75.00%
C5 Hinge(2, 2, -, false, false) 78.95%
BiC(RoBic,SVM) Hinge(1, 2, -, false, false) 90.79%±7.6
Table 1: Summary of the Results for Different Models.


Return to main RoBiC page.