Think of playing "20 questions": I am thinking of an integer between
1 and 1,000 -- what is it?
What is the first question you would ask?
Why? Because this answer provides the most information:
It typically makes sense to ask a question that
"splits" the remaining options in half,
whether the response is "Yes" or "No".
(Here, if I answer "Yes", the number is in the range {1,..., 500},
and if I answer "No", the number is in the range {501, ..., 1000};
either way, there are only 500 possible values, which is half of the original
1000.)
This is typically viewed in terms of "entropy",
which (here) measures how much MORE information you need before you can
identify the integer.
(Entropy is basically "minus information".)
Initially, there are 1000 possible values, which we assume are equally likely.
We therefore need to ask (roughly) 10 more "Yes/No" questions to identify
the integer; this is the entropy of this "uniform over 1000 values"
distribution.
(To understand why: see Information Theory Note.)
We can use this idea to decide on the appropriate "splitting criteria":
As discussed above, as the LearnDT algorithm is building the decision
tree,
it is dividing, and sub-dividing, the set of "training instances"
(eg, descriptions of the games)
based on the attributes used in the various nodes encountered on the path.
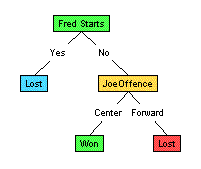
Eg, for the figure below:
all 20 records reach the root node (labeled "FredStarts");
of these, 10 go right (corresponding to "FredStarts=No")
to the node labeled "JoeOffense", etc.

Simple Decision Tree
Each node, therefore, corresponds to the set of records that
reach that position, after being filtered by the sequence of
"attribute = value" assignments.
(Eg, of the 10 records that survive the "FredStarts=No" test
at the root,
only 4 survive the subsequent "JoeOffence=Center" test
to reach the left child of that node.)
LearnDT in general will
use these records to decide which attribute to select for that node.
It does this by considering each of the eligible attributes --- ie,
the ones that have NOT been used in the path to this node.
For each such attribute,
it computes the "quality" of the split produced by this attribute;
it then selects the attribute with the best quality.
One quality measure is "Information Gain":
Given a set of records,
the quality of each attribute is the average of the entropies
of the nodes produced by this split.
Well... minus this quantity.
(Recall that "information = minus entropy".)
That is, we want to gain as much information as possible,
to produce a situation where the remaining entropy is as small as possible.
("0 entropy" means that we can identify the integer...
we are trying to get to this situation.))
If that made sense, great.
If not, and you want to see this in detail,
see Information Gain details.
Otherwise, feel free to skip the details, and just
play with the code:
Now you try it...
 Enough talk. What really happens here?
 To try out this criteria:
Go back to the
applet,
but here change the "Splitting Function" to "Gain".
Of course, make sure you're viewing the "Basketball" dataset.
If you then type "<Ctrl><Alt>R"
(that is, while holding down both the "Ctrl" and "Alt" keys, also type "R");
or alternatively, just pull down "Run" from the "Algorithm" menu),
you will see the resulting decision tree (Note that is will NOT be the tree shown above).
Left-clicking on any node in the tree will highlight the examples from the "Basketball"
dataset that reach the node (look for the yellow, highlighted rows in the upper left-hand table).
There are MANY other things you can do using this applet --
eg, adjust the splitting function, grow your own tree, trace the code, watch
it running slowly, etc etc etc.
See Manual for details.


