Technical Summary:
What do developers know about Software Energy consumption and power use?
by Candy Pang, University of Alberta, Edmonton, Alberta, Canada (cspang@ualberta.ca),
Abram Hindle, University of Alberta, Edmonton, Alberta, Canada (abram.hindle@ualberta.ca),
Bram Adams, Polytechnique Montréal, Montréal, Québec, Canada (bram.adams@polymtl.ca),
Ahmed E. Hassan, Queen’s University, Kingston, Ontario, Canada (ahmed@cs.queensu.ca)
Traditionally programmers are trained for specific programming language and programming tactics. The popularity of mobile device and cloud computing data center has drawn attention to the software energy efficiency. Mobile devices have limited power; therefore the less power used the merrier. Data center runs a large number of software. If individual software can reduce its energy consumption, accumulatively the power reduction will be significant for a data center. Prevention is better than mitigation. Delivering energy efficient software creates happy clients and reduces rectification cost.
To produce energy efficient software, the programmers must be attentive about software energy consumption, similar to parallel programming in that sense. However, we don’t know how much programmers know or aware of software energy consumption. Through survey and interview, we conclude that programmers are lacking of knowledge in power usage qualitatively and quantitatively. Software energy efficiency has a lot of room for improvement through programmers’ education and programming tools.
1. Introduction
Programmers receive a wide variety of training. This training often focuses non-functional requirements or performance related characteristics, for example object-oriented programming methodology. With the advent of mobile devices, these traditional characteristics may not be as relevant. Furthermore programmers might not have training relevant to energy consumption of software. Thus we want to know what programmers know about software energy consumption and the depth of their knowledge in power usage qualitatively and quantitatively.
Currently we do not know how often programmers consider power related issues in software development. Through survey we query programmers about their own experiences or lack of experience with software power consumption.
According to the survey, more than 80% of the programmers do not take energy consumption into account when developing software. However, more than 60% of the programmers consider power usage one of the decision factors in mobile development platform selection.
The survey result helps us understand programmers’ blind spots and determine future tool development.
2. Survey Methodology
In Google Drive, we create Google Form to gather anonymous survey data [1]. There are 13 questions in the survey. After filling the survey, the respondents are given the opportunity to participate in an optional interview. The interview contains 9 questions. The survey and the optional interview are approved by the University of Alberta Research Ethics Office [2]. Through the survey, we will evaluate the programmers’ knowledge on software energy consumption qualitatively and quantitatively.
2.1. Survey Details
The first three questions are categorization questions, which classify respondents into different categories.
1. How many years of programming experience do you have?
2. How would you rank your programming skill? (Choose between: beginner, intermediate, advance.)
3. What is your most proficient programming language?
The next two questions are skill-and-knowledge questions, to evaluate respondents’ current knowledge in software power consumption.
4. On a desktop computer, please rank the software power consumption level of the following components (CPU, Hard Disk Drive, Memory, Network, and Screen & GPU).
5. On a mobile device, please rank the software power consumption level of the following components (CPU, Data Storage Device, Memory, Network, and Screen & GPU).
The next six yes-no questions gather information about respondents’ experience in software power consumption. If respondents answer yes to question 10, addition space is provided for textual responses.
6. Do you take power consumption into account when developing software?
7. Is minimizing power consumption a requirement or concern of your software
8. Have users complained about the power consumption of your software?
9. Have you modified your software to reduce power consumption?
10. Have you measured the
power consumption of your software?
If yes, how do you measure power consumption of your software?
11. Would power consumption be one of your decision factors when choosing a mobile development platform?
The last two are open-ended questions for respondents to freely express their knowledge and experience.
12. What software functions have higher power consumption?
13. How would you improve power efficiency of your software?
The survey is short and simple to attract respondents. Simple questions can sometimes be ambiguous, especially question 4 & 5. We decide to keep the questions simple and leave them to respondents’ interpretation.
The survey targets programmers as respondents. Therefore survey invitations are posted to programming related sub-reddits [3]. Between August 20, 2013 and September 4, 2013, the survey invitations are posted in the following sub-reddits.
· http://www.reddit.com/r/programming/
· http://www.reddit.com/r/learnprogramming
· http://www.reddit.com/r/coding
· http://www.reddit.com/r/androiddev
· http://www.reddit.com/r/compsci
· http://www.reddit.com/r/Java
· http://www.reddit.com/r/tinycode
As of September 10, 2013, 115 anonymous responses were received when the analysis started. As of November 3, 2013, 127 anonymous responses were received, and no more responses received afterward. All data analysis has been updated with data collected up to November 3, 2013. Base on the submitted data and timestamps, five records were determined to be duplicated submissions. The survey data is analyzed in Section 3 and 4.
2.2. Interview Details
At the end of the survey, the respondents are invited to participate in an optional interview. As of September 4, 2013, nineteen respondents volunteer for the optional interview by providing contact information. There are nine interview questions.
1. How do you measure power consumption of your software?
2. What software functions have higher power consumption?
3. How would you improve power efficiency of your software?
4. How important it is for you to minimize the power consumption of your software? Why?
5. What are your top concerns about software power consumption for desktop computers?
6. What are your top concerns about software power consumption for mobile devices?
7. Do you have different coding practices when implementing software for desktop computers versus mobile devices?
8. What will be your top three software power efficiency advances for others?
9. Do you have a cool story to share about software power consumption?
Questions 1 to 3 are repeated from the survey. The intension is to get more details from the respondents through interaction in the interview. The rest of the questions are intended to draw knowledge and experience from the respondents.
Among the nineteen respondents signed up for the optional interview. At the end we get in touch with six of the respondents, and all of them selected to answer the interview questions through emails. By the end of September 2013, we have received four responses. Response summary is provided in Section 4.
3. Data Analysis and Findings
Question 1 to 11 collect structured data from the respondents. The structured data is summarized and analyzed in this section.
3.1. Question 1
Question 1 asks the respondents the number of years of experience in programming. The answers are grouped into ranges of 3-year, as shown in Figure 1. As seen in the chat, 96 out of 122 respondents have 12 years or less experience. There is a significant drop in number of participants with more than 12 years of experience. This may reflect the reddit’s demographic distribution or the bubble bust around the year 2000.
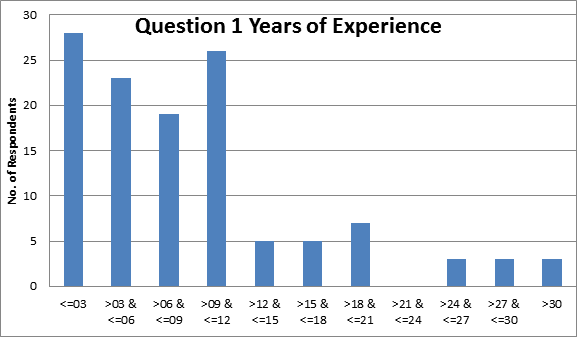
Figure 1 Respondents years of experience
3.2. Question 2
Question 2 asks the respondents about their programming skill. The answers are summarized in Figure 2.
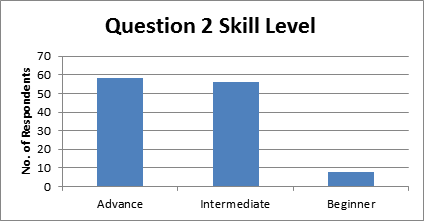
Figure 2 Respondents skill levels
3.3. Question 3
Question 3 asks the respondents for their most proficient programming language. Two respondents provided two languages and two respondents provided three languages. For these four respondents, each of their provided language is counted as separated entry. The language ECMA SCRIPT is combined with JAVASCRIPT; the languages SCHEME and CLOJURE are combined with LISP. The answers are summarized in Figure 3.
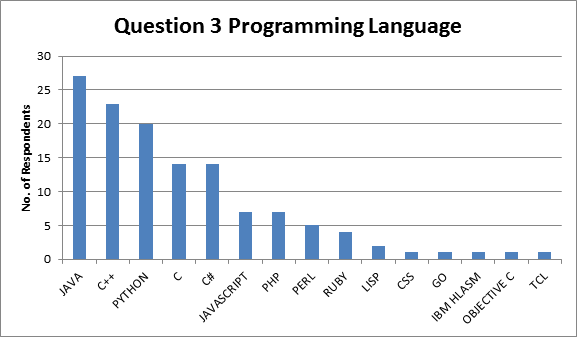
Figure 3 Respondents programming languages
The languages CSS, GO, IBM HLASM, LISP, OBJECTIVE C and TCL used by only one or two respondents. The numbers of respondents for these languages are insignificant and not reported in the rest of the analysis.
3.4. Question 4 and 5
Question 4 and 5 are the skill-and-knowledge questions. These two questions are designed to be imprecise intentionally. There will be further discussion about the design of these questions in Section 5.
Google Form does not provide the option to create ranking question. Therefore, we used grid for question 4 and 5. However, there is limitation data validation applied to grid. In result, one respondent in question 4 and two respondents in question 5 select the same component for two different ranking. In question 4, one respondent ranked Memory the third and the fifth, but missing Screen & GPU. In question 5, one respondent ranked Data Storage Device the third and the fifth, but missing Memory. Another respondent in question 5 ranked Screen & GPU the first and the third, but missing Memory. We do not know whether the respondents made these rankings intentionally or by mistake, therefore we keep these rankings as-is in our data analysis.
The respondent’s rankings for question 4 and 5 are summarized in Figure 4 and Figure 5.
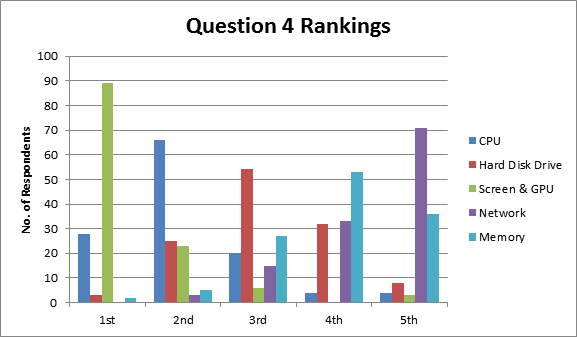
Figure 4 Components ranking in question 4
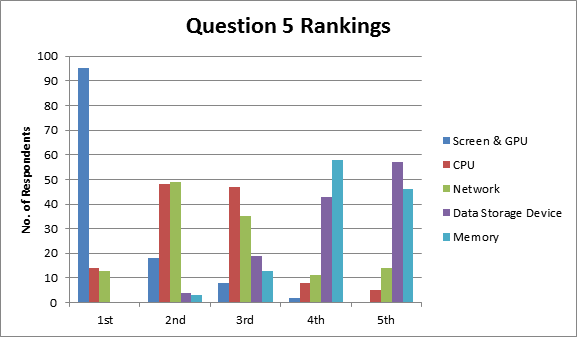
Figure 5 Components ranking in question 5
For question 4, the expected ranking of software power consumption on a desktop computer is (1) CPU; (2) Hard Disk Drive; (3) Screen & GPU; (4) Network; (5) Memory. This ranking is not the definite answer. Many factors affect component power consumption. This is the ranking our analysis bases on.
Respondents’ rankings are compared with the expected ranking through square-distance measurement shows in Equation 1

Equation 1
The average square-distance of all respondents is 10.082. Averages by different categories are shown in Table 1 to Table 3.
|
Years of experience |
<=03 |
>03 & <=06 |
>06 & <=09 |
>09 & <=12 |
>12 & <=15 |
>15 & <=18 |
>18 & <=21 |
>24 & <=27 |
>27 & <=30 |
>30 |
Average \ Total |
|
Sq-dist |
10.500 |
11.130 |
12.316 |
9.308 |
10.400 |
9.600 |
7.429 |
6.667 |
6.000 |
4.667 |
8.802 |
|
Count |
28 |
23 |
19 |
26 |
5 |
5 |
7 |
3 |
3 |
3 |
122 |
Table 1 Question 4 sq-distance by years of experience
|
Skill level |
Sq-dist |
Count |
|
Advance |
9.862 |
58 |
|
Intermediate |
10.429 |
56 |
|
Beginner |
9.250 |
8 |
|
Average \ Total |
9.847 |
122 |
Table 2 Question 4 sq-distance by skill lvels
|
Programming language |
C |
C# |
C++ |
JAVA |
JAVASCRIPT |
PERL |
PHP |
PYTHON |
RUBY |
Average \ Total |
|
Sq-dist |
10.429 |
13.000 |
9.826 |
10.741 |
10.000 |
14.800 |
10.857 |
8.500 |
6.500 |
10.517 |
|
Count |
14 |
14 |
23 |
27 |
7 |
5 |
7 |
20 |
4 |
121 |
Table 3 Question 4 sq-distance by programming languages
The answers from question 4 shows that programmers with more years of experience tend to know more about software power consumption on desktop computer. To our surprise, the Beginner programmers are doing better than the Intermediate and Advance programmers in question 4. In addition, the C, C++, JAVASCRIPT, PYTHON and RUBY programmers score better than the all-respondent average (10.517).
For question 5, the expected ranking of software power consumption on a mobile device is (1) Screen & GPU; (2) CPU; (3) Network; (4) Hard Disk Drive; (5) Memory. As mentioned in question 4, this ranking is not the definite answer, it is just the ranking used in our analysis. Respondents’ rankings are compared with the expected ranking through square-distance measurement shows in Equation 1
The average square-distance of all respondents is 4.943. Averages by different categories are shown in Table 4 to Table 6.
|
Years of experience |
<=03 |
>03 & <=06 |
>06 & <=09 |
>09 & <=12 |
>12 & <=15 |
>15 & <=18 |
>18 & <=21 |
>24 & <=27 |
>27 & <=30 |
>30 |
Average \ Total |
|
Sq-dist |
5.857 |
5.217 |
4.737 |
4.654 |
4.400 |
1.200 |
4.857 |
2.000 |
5.333 |
8.000 |
4.626 |
|
Count |
28 |
23 |
19 |
26 |
5 |
5 |
7 |
3 |
3 |
3 |
122 |
Table 4 Question 5 sq-distance by years of experience
|
Skill level |
Sq-dist |
Count |
|
Advance |
4.741 |
58 |
|
Intermediate |
5.286 |
56 |
|
Beginner |
4.000 |
8 |
|
Average \ Total |
4.676 |
122 |
Table 5 Question 5 sq-distance by skill levels
|
Programming language |
C |
C# |
C++ |
JAVA |
JAVASCRIPT |
PERL |
PHP |
PYTHON |
RUBY |
Average \ Total |
|
Sq-dist |
5.357 |
5.286 |
5.304 |
4.370 |
5.429 |
9.600 |
5.143 |
4.000 |
4.500 |
5.443 |
|
Count |
14 |
14 |
23 |
27 |
7 |
5 |
7 |
20 |
4 |
121 |
Table 6 Question 5 sq-distance by programming languages
The first obvious difference between the answers from question 4 and 5 is the average square-distance. The average square-distance of question 5 is 4.943, which is much lower than the average 10.517 of question 4. This may indicate that the programmers participated in the survey are more familiar with mobile devices.
Unlike question 4 with desktop computer, programmers with more years of experience do not show better knowledge in question 5 with mobile devices. As in question 4, Beginner programmers are surprisingly doing better than Intermediate and Advance programmers. For different programming languages, the JAVA, PYTHON and RUBY programmers score better than the all-respondent average (4.943).
In addition to the square-distance analysis, we investigate how respondents rank the components in questions 4 and 5. Many respondents have the same ranking in question 4 and 5.
The rankings that appear 5 times of more in question 4 for desktop computer are shown in Table 7.
|
Question 4 Ranking |
Count |
|
Screen & GPU > CPU > Hard Disk Drive > Memory > Network |
28 |
|
Screen & GPU > CPU > Memory > Hard Disk Drive > Network |
14 |
|
CPU > Screen & GPU > Hard Disk Drive > Memory > Network |
11 |
|
Screen & GPU > CPU > Hard Disk Drive > Network > Memory |
10* |
|
Screen & GPU > Hard Disk Drive > CPU > Memory > Network |
9 |
|
Screen & GPU > Hard Disk Drive > CPU > Network > Memory |
8 |
|
Screen & GPU > CPU > Network > Hard Disk Drive > Memory |
7 |
|
CPU > Screen & GPU > Memory > Hard Disk Drive > Network |
6 |
|
Screen & GPU > CPU > Memory > Network > Hard Disk Drive |
5 |
|
The rest of various rankings |
24 |
|
Total |
122 |
Table 7 Question 4 responses ordering
More than half of the respondents selected Screen & GPU as the most power consuming component, while Screen & GPU are ranked third in the expected ranking. The square-distance between the first and the fourth ranking is (3-1)2=4. Therefore, the average square-distance for question 4 is relatively high compare with question 5.
Actually, only one respondent ranks the components exactly in our expected order. Taking Screen & GPU out of the account, ten respondents rank the rest of the components in our expected, marked by asterisk (*). In total, 89 respondents have ranked Screen & GPU as the highest power consuming components in question 4. Removing the Screen & GPU from the responses, the average square-distance for question 4 is much closer to question 5. Consistent with the analysis above, many of the survey participants may be mobile device programmers. To mobile device programmers, Screen & GPU is the highest power consuming component.
Correspondingly, the rankings that appear 4 times of more in question 5 for mobile device are shown in Table 8.
|
Question 5 Ranking |
Count |
|
Screen & GPU > Network > CPU > Data Storage Device > Memory |
19 |
|
Screen & GPU > CPU > Network > Memory > Data Storage Device |
17 |
|
Screen & GPU > Network > CPU > Memory > Data Storage Device |
16 |
|
Screen & GPU > CPU > Network > Data Storage Device > Memory |
12* |
|
Screen & GPU > CPU > Memory > Network > Data Storage Device |
5 |
|
Network > Screen & GPU > CPU > Data Storage Device > Memory |
5 |
|
Screen & GPU > CPU > Data Storage Device > Memory > Network |
4 |
|
CPU > Screen & GPU > Network > Memory > Data Storage Device |
4 |
|
CPU > Screen & GPU > Data Storage Device > Memory > Network |
4 |
|
The rest of various rankings |
36 |
|
Total |
122 |
Table 8 Question 5 responses ordering
Compare with question 4, twelve respondents rank the components in our expected order, marked by asterisk (*), which have zero square-distance value. Like question 4, 95 respondents rank Screen & GPU as the most power consuming components in question 5.
3.5. Question 6 to 11
Questions 6 to 11 are yes-no questions related to respondents’ experience in software power consumption. The answers are summarized in Figure 6. As seen in the chat, 100 respondents answer NO in question 6 and 96 answer NO in question 9. These two questions seem to be co-related. Further analysis shows that 106 (90—NO; 16—YES) out of 122 participants provide the same answer for question 6 and question 9. Hence whether programmers take into account power consumption during software development relates to whether programmers modify software to reduce power consumption. While NO is the predominant answers in question 6 to 10, 79 out of 122 (65%) of the respondents answer YES in question 11. The result reflects that most programmers rely on the development platform to make software energy efficient.
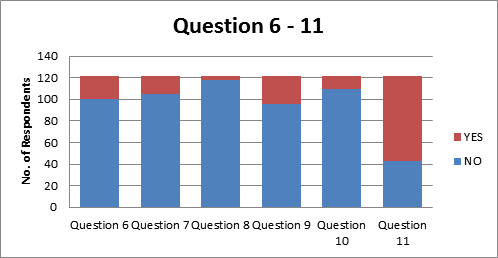
Figure 6 Responses to question 6—11
Answers for questions 6 to 11 combined with years of programming experience are summarized in Table 9. All groups with 15 years of experience or less follow the overall trends, hence more NO than YES in questions 6 to 10 and more YES than NO in question 11. In the groups with more than 15 years of experience, there are a few deviations marked by asterisk (*). Experience may have positive influence on creating energy efficient software.
|
Years of |
Question 6 |
Question 7 |
Question 8 |
Question 9 |
Question 10 |
Question 11 |
|
<=03 |
28 |
28 |
28 |
28 |
28 |
28 |
|
NO |
26 |
26 |
28 |
26 |
28 |
11 |
|
YES |
2 |
2 |
0 |
2 |
0 |
17 |
|
>03 & <=06 |
23 |
23 |
23 |
23 |
23 |
23 |
|
NO |
21 |
20 |
22 |
22 |
21 |
8 |
|
YES |
2 |
3 |
1 |
1 |
2 |
15 |
|
>06 & <=09 |
19 |
19 |
19 |
19 |
19 |
19 |
|
NO |
15 |
16 |
18 |
16 |
17 |
7 |
|
YES |
4 |
3 |
1 |
3 |
2 |
12 |
|
>09 & <=12 |
26 |
26 |
26 |
26 |
26 |
26 |
|
NO |
19 |
21 |
24 |
17 |
22 |
10 |
|
YES |
7 |
5 |
2 |
9 |
4 |
16 |
|
>12 & <=15 |
5 |
5 |
5 |
5 |
5 |
5 |
|
NO |
5 |
4 |
5 |
3 |
4 |
1 |
|
YES |
0 |
1 |
0 |
2 |
1 |
4 |
|
>15 & <=18 |
5 |
5 |
5 |
5 |
5 |
5 |
|
NO |
2* |
4 |
5 |
3 |
5 |
0 |
|
YES |
3* |
1 |
0 |
2 |
0 |
5 |
|
>18 & <=21 |
7 |
7 |
7 |
7 |
7 |
7 |
|
NO |
7 |
7 |
7 |
5 |
7 |
4* |
|
YES |
0 |
0 |
0 |
2 |
0 |
3* |
|
>24 & <=27 |
3 |
3 |
3 |
3 |
3 |
3 |
|
NO |
1* |
2 |
3 |
1* |
2 |
0 |
|
YES |
2* |
1 |
0 |
2* |
1 |
3 |
|
>27 & <=30 |
3 |
3 |
3 |
3 |
3 |
3 |
|
NO |
2 |
2 |
3 |
1* |
1* |
1 |
|
YES |
1 |
1 |
0 |
2* |
2* |
2 |
|
>30 |
3 |
3 |
3 |
3 |
3 |
3 |
|
NO |
2 |
3 |
3 |
2 |
3 |
1 |
|
YES |
1 |
0 |
0 |
1 |
0 |
2 |
|
Total |
122 |
122 |
122 |
122 |
122 |
122 |
|
NO |
100 |
105 |
118 |
96 |
110 |
43 |
|
YES |
22 |
17 |
4 |
26 |
12 |
79 |
Table 9 Question 6—11 responses grouped by years of experience
Answers for questions 6 to 11 combined with programming skill levels are summarized in Table 10. Answers from all skill levels align with the overall trends.
|
Skill level |
Question 6 |
Question 7 |
Question 8 |
Question 9 |
Question 10 |
Question 11 |
|
Advance |
58 |
58 |
58 |
58 |
58 |
58 |
|
NO |
42 |
48 |
55 |
38 |
48 |
21 |
|
YES |
16 |
10 |
3 |
20 |
10 |
37 |
|
Intermediate |
56 |
56 |
56 |
56 |
56 |
56 |
|
NO |
51 |
50 |
55 |
51 |
54 |
18 |
|
YES |
5 |
6 |
1 |
5 |
2 |
38 |
|
Beginner |
8 |
8 |
8 |
8 |
8 |
8 |
|
NO |
7 |
7 |
8 |
7 |
8 |
4 |
|
YES |
1 |
1 |
0 |
1 |
0 |
4 |
|
Total |
122 |
122 |
122 |
122 |
122 |
122 |
|
NO |
100 |
105 |
118 |
96 |
110 |
43 |
|
YES |
22 |
17 |
4 |
26 |
12 |
79 |
Table 10 Question 6—11 responses grouped by skill levels
Answers for questions 6 to 11 combined with different programming languages are summarized in Table 11. All groups follow the trends that there are more NO than YES in question 6 to 10 and more YES than NO in question 11, with 2 exceptions marked by asterisk (*). In question 11, the C# and RUBY programmers have equal numbers of YES and NO.
|
Programming |
Question 6 |
Question 7 |
Question 8 |
Question 9 |
Question 10 |
Question 11 |
|
C |
14 |
14 |
14 |
14 |
14 |
14 |
|
NO |
9 |
9 |
14 |
8 |
11 |
5 |
|
YES |
5 |
5 |
0 |
6 |
3 |
9 |
|
C# |
14 |
14 |
14 |
14 |
14 |
14 |
|
NO |
13 |
14 |
14 |
13 |
14 |
7* |
|
YES |
1 |
0 |
0 |
1 |
0 |
7* |
|
C++ |
23 |
23 |
23 |
23 |
23 |
23 |
|
NO |
16 |
19 |
23 |
18 |
22 |
4 |
|
YES |
7 |
4 |
0 |
5 |
1 |
19 |
|
JAVA |
27 |
27 |
27 |
27 |
27 |
27 |
|
NO |
22 |
22 |
25 |
20 |
24 |
11 |
|
YES |
5 |
5 |
2 |
7 |
3 |
16 |
|
JAVASCRIPT |
7 |
7 |
7 |
7 |
7 |
7 |
|
NO |
5 |
5 |
6 |
5 |
5 |
1 |
|
YES |
2 |
2 |
1 |
2 |
2 |
6 |
|
PERL |
5 |
5 |
5 |
5 |
5 |
5 |
|
NO |
5 |
5 |
5 |
5 |
5 |
2 |
|
YES |
0 |
0 |
0 |
0 |
0 |
3 |
|
PHP |
7 |
7 |
7 |
7 |
7 |
7 |
|
NO |
6 |
7 |
7 |
5 |
6 |
3 |
|
YES |
1 |
0 |
0 |
2 |
1 |
4 |
|
PYTHON |
20 |
20 |
20 |
20 |
20 |
20 |
|
NO |
16 |
17 |
20 |
17 |
20 |
6 |
|
YES |
4 |
3 |
0 |
3 |
0 |
14 |
|
RUBY |
4 |
4 |
4 |
4 |
4 |
4 |
|
NO |
4 |
4 |
4 |
4 |
4 |
2* |
|
YES |
0 |
0 |
0 |
0 |
0 |
2* |
|
Total |
121 |
121 |
121 |
121 |
121 |
121 |
|
NO |
96 |
102 |
118 |
95 |
111 |
41 |
|
YES |
25 |
19 |
3 |
26 |
10 |
80 |
Table 11 Question 6—11 responses grouped by programming languages
Data collected from question 6 to 10 indicates that very little has been considered or done in reducing software power consumption. In question 6, only 18% of the programmers take power consumption into account when developing software. In question 7, just 14% of the programmers concern about minimizing power consumption. In question 8, scarcely 3% of the programmers have their users complain about power consumption. In question 9, 21% of the programmers modified software to reduce power consumption. In question 10, merely 10% of the programmers measure the power consumption of their software. Juxtapose, when choosing a mobile development platform, 65% of the developers care about the power efficiency of the software platform in question 11. The data shows that a lot can be done on improving programmers’ knowledge in software power efficiency, and consumers’ knowledge about energy consumption.
4. Textual Data Analysis and Findings
Survey question 10, 12 and 13 include textual responses. Textual responses are not as easy to analysis as structural responses. Therefore, we decided to manually label the textual responses from the survey and the first three questions from the interviews. The first author manually went through all textual responses to identify keywords or ideas from the respondents. Then, the first author iterated through the textual responses multiple times to refine the identified set of keywords and ideas until the set proper reflect all textual responses.
For question 10, the measurement mechanisms identified by the respondents are shown in Figure 7 ordered by count.
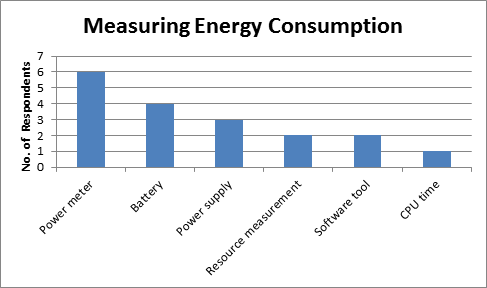
Figure 7 Energy comsumption measuring labels
Among the identified mechanisms, only Resource measurement is a little ambitious. The rest of the mechanisms are commonly used in power consumption measurement. In total, there are only 18 out of 122 respondents provided answers to this question. Hence programmers are generally no familiar with power measurement.
For question 12, the software functions with higher power usage or energy consumption identified by the respondents are shown in Figure 8 ordered by count.
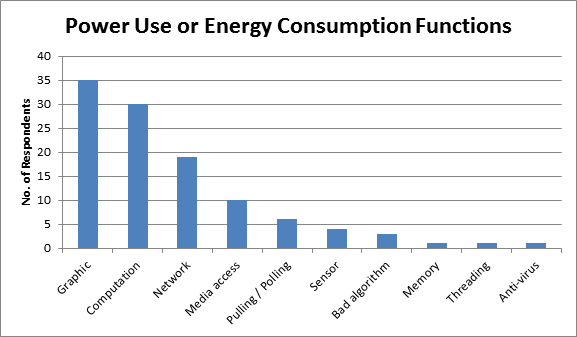
Figure 8 Energy concumption function lables
Question 12 is an open-end question. The respondents answer in text whatever they consider to be high power consumption software functions. Many of the high power consumption software functions have been identified, such as Graphic, Pulling or polling, Sensor and Bad algorithm. Others functions might have relatively high power consumption depends on their usages and comparison with what other alternatives.
For question 13, the improvements suggested by the respondents are shown in Figure 9 ordered by count.
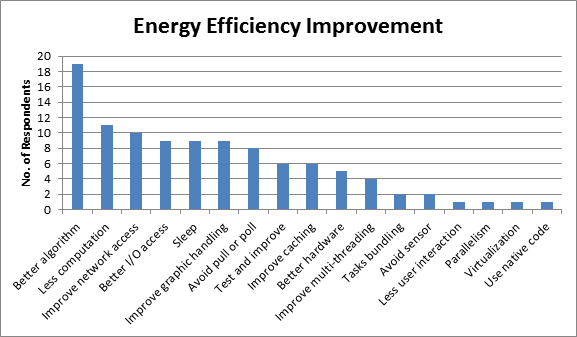
Figure 9 Energy efficiency improvement labels
As mentioned by one of the interview respondent, “it's more often the hardware rather than the software that we are interested in when we talk about power consumption.” Actually, software also plays an important role in power consumption. Because of its lack of publicity, it is very important to raise awareness about software power consumption.
One interview respondent has properly pointed out that “one has to have a proper understanding of the entire system [to] make an informed [power consumption] analysis.” Even similar software functions may involve different hardware procedures, with different power consumption footprint. In addition, the timing and frequency of some hardware procedures may also affect power consumption. For example, reading from a hard-disk-drive while it is spinning has low cost. However, reading from a hard-disk-drive from its stopped state will be more costly. Software power efficiency evaluation can be complicated by diverse interactions between components.
Finally, it is a real world challenge for the programmers to find extra time and effort in improving software power efficiency. As mentioned by an interview respondent, clients “care first and foremost about speed of development, and secondly about reasonable quality and performance”. A lot of works need to be done to raise the public awareness about software power efficiency. Just like people nowadays are more aware that security should be part of application’s requirements, not improvement.
5. Limitation
Recruiting survey respondents from social media has its strength and weakness. Through social media, we can reach people in the field whom otherwise cannot be reached. On the other hand, we need to deal with people who have strong opinion against our topic. These strong opponents may try to prevent the survey from proceeding, pressure peers into opponents, or attack the surveyors. For these reasons, we have been very careful and restraint on posting the survey invitation to limited groups. In addition, the survey invitation was posted to one group at a time to make sure respondents’ concerns were addressed and damages were controlled.
Designing the proper skill-and-knowledge questions (survey question 4 & 5) for software power consumption is challenging. There are many factors that affect power consumption. From the hardware perspective, different type of CPUs, storage devices, cable versus Wi-Fi, screen size and type will all affect power consumption. From the usage perspective, desktop applications, mobile device applications, virtual applications and graphic-intense games have different power consumption load on different components.
Precise skill-and-knowledge questions with absolute un-arguable answers would likely be very obvious which do not worth asking. Therefore, we decided to go with general questions, which open for respondents’ interruption. More importantly, the purpose of these skill-and-knowledge questions is to make the respondents more aware about software power consumption. One reddit participant has posted the comment that “… this survey has at least made me consider … some possible costs of doing things like GPU offloading …”
6. Conclusion
From the survey and interview, we find that most application users are ignorant about software energy consumption. Since users are not aware of the importance of power usage, most programmers put little effort in improving software energy efficiency. While most programmers know that they should have considered software power related issues. The results indicate that there is a lot of room to improve programmers’ knowledge in software energy consumption. In addition, tools that identify power usage problems or provide power reduction suggestions to programmers will be very useful.
Bibliography
|
[1] |
"Green Programmer Survey: What Do Programmers Know About Power?," [Online]. Available: http://green-programmer-survey.softwareprocess.es. |
|
[2] |
"University of Alberta Research Ethic Office," [Online]. Available: http://www.reo.ualberta.ca/. |
|
[3] |
"Reddit," [Online]. Available: http://www.reddit.com. |